It’s probably hard to believe it at first but a vehicle’s color can have a negative or a positive impact on its value and according to a new survey, the resale value could differ by as much as $5,000 depending on the color. This is what iSeeCars’ recent study discovered after the company analyzed and compared pricing data for over 1.3 million three-year-old used cars on the US market.
The car buying site – which is not commercially affiliated with Motor1.com in any way – was able to gather interesting insights regarding the color trends in the used car market using data generated by its own selling platform. The data is divided into car segments and below you’ll find more information about the truck and car segments on the US used car market.
We are a little surprised to see that beige is the color with the lowest depreciation rate in the truck segment but there’s an easy explanation for that – this hue has been associated with special off-road trims for models such as the Jeep Gladiator and Toyota Tacoma TRD. Combined, these two models – together with a few other models in beige and tan – give the color the top stop in the truck segment with a depreciation rate of just 7.9 percent over a three-year period.
| Truck depreciation by color | |||
| Rank | Color | 3-Year % Depreciation | $ Difference from MSRP |
| 1 | Beige | 7.9% | $3,640 |
| 2 | Orange | 10.9% | $4,993 |
| 3 | Green | 11.6% | $6,189 |
| 4 | Brown | 13.2% | $6,932 |
| 5 | Gray | 15.1% | $7,411 |
| 6 | White | 15.1% | $7,545 |
| Truck Average | 15.6% | $7,786 | |
| 7 | Black | 16.1% | $8,232 |
| 8 | Red | 16.1% | $8,114 |
| 9 | Purple | 16.2% | $8,553 |
| 10 | Blue | 16.3% | $8,184 |
| 11 | Silver | 16.5% | $8,042 |
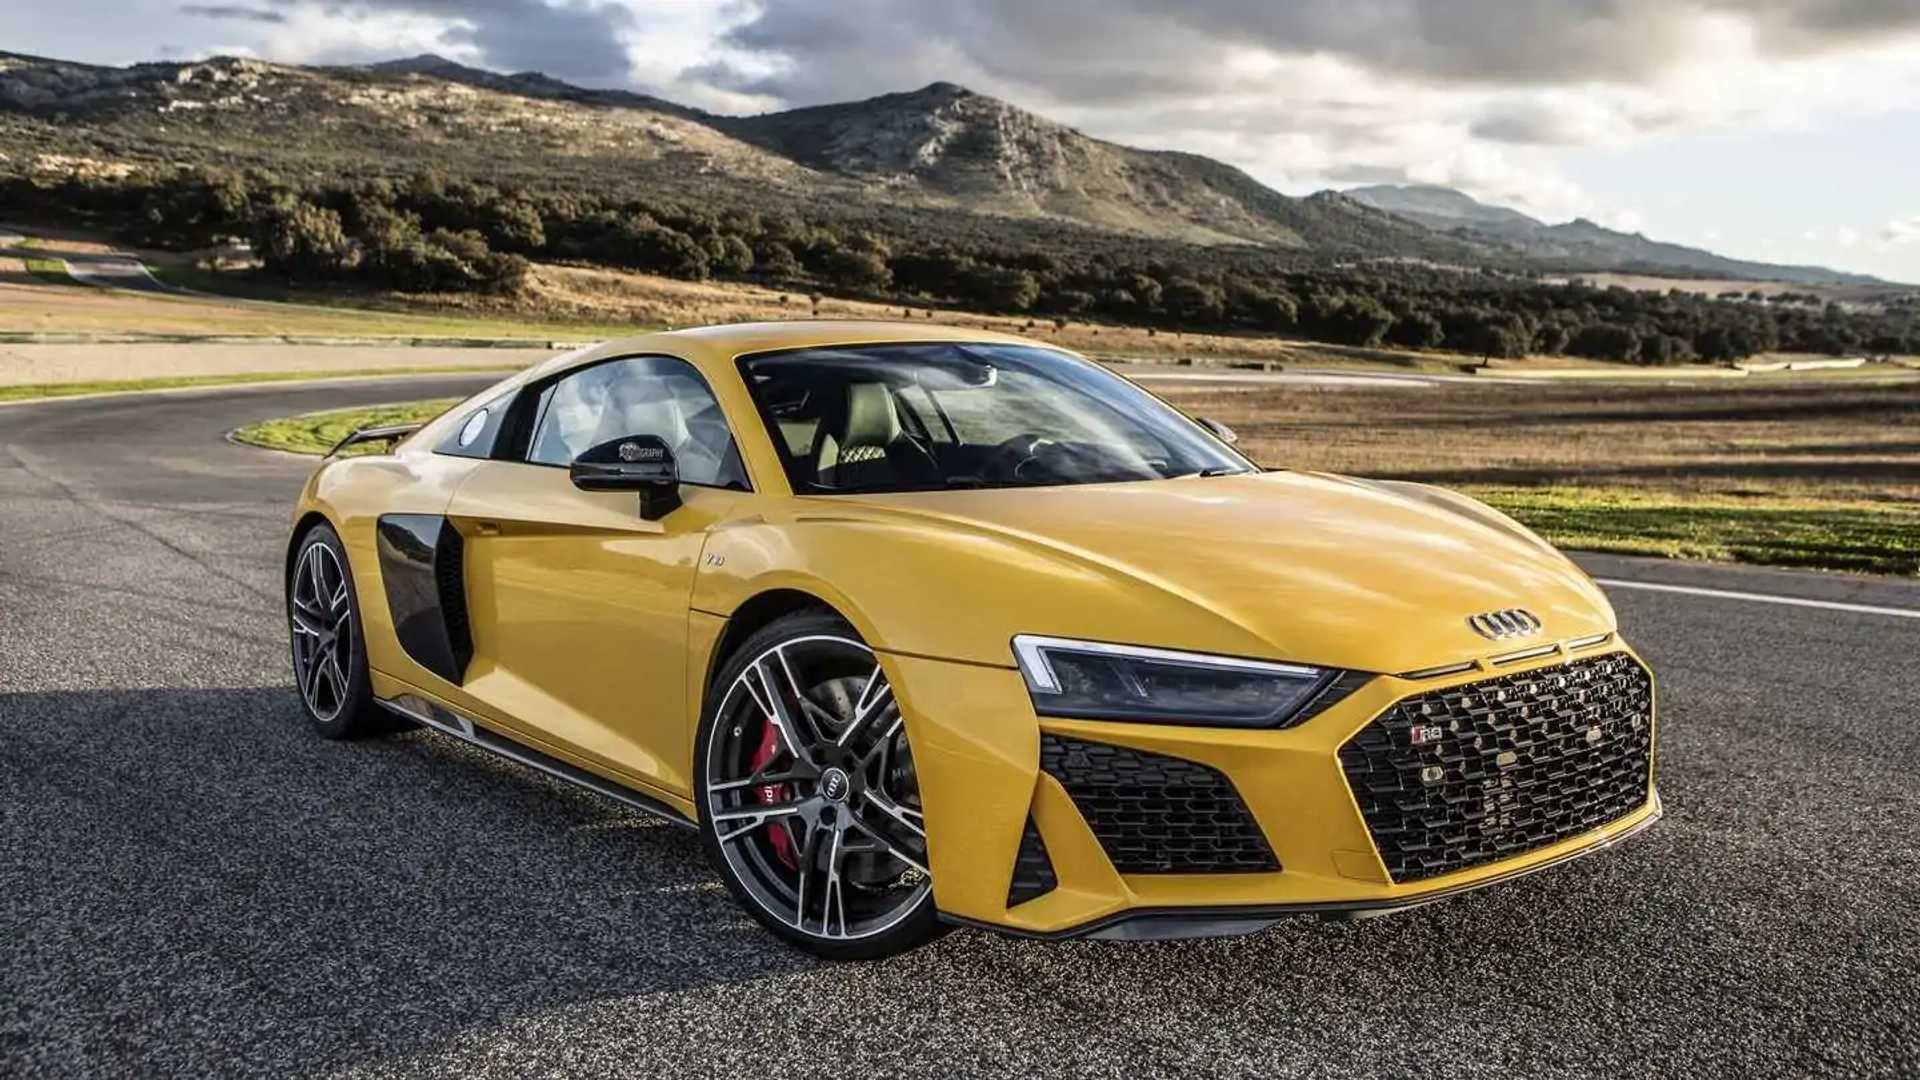
Gallery: 2019 Audi R8 V10 Performance Quattro Vegas Yellow


In the car segment, yellow is the dominating color with a depreciation rate of 13.5 percent, followed by beige (17.8 percent depreciation) and orange (18.4 percent depreciation). The results were very similar some two years ago and it seems that yellow is the color to go for if you want your vehicle to hold its value as strong as possible. The high number of yellow sports cars and supercars is probably the easiest explanation for this trend, which keeps this color well below the segment’s average depreciation rate of 22.5 percent over a three-year period.
| Vehicle depreciation by color | ||||
| Rank | Color | 3-Year % Depreciation | $ Difference from MSRP | Compared to Overall Avg. |
| 1 | Yellow | 13.5% | $6,588 | 0.6x |
| 2 | Beige | 17.8% | $8,411 | 0.8x |
| 3 | Orange | 18.4% | $7,023 | 0.8x |
| 4 | Green | 19.2% | $8,719 | 0.9x |
| 5 | Red | 20.6% | $8,538 | 0.9x |
| 6 | White | 21.9% | $9,695 | 1.0x |
| 7 | Blue | 22.0% | $9,216 | 1.0x |
| 8 | Gray | 22.5% | $9,425 | 1.0x |
| Overall Average | 22.5% | $9,674 | – | |
| 9 | Purple | 22.7% | $8,840 | 1.0x |
| 10 | Silver | 23.2% | $9,218 | 1.0x |
| 11 | Black | 23.9% | $10,867 | 1.1x |
| 12 | Brown | 24.0% | $10,305 | 1.1x |
| 13 | Gold | 25.9% | $11,546 | 1.2x |
Yellow is also the most valuable color in the SUV, coupe, and convertible segments, iSeeCars' latest study shows. More details about these segments, plus minivans and sedans, can be found at the source link below.


