What Is a P/E (Price-to-Earnings) Ratio?
A P/E (price-to-earnings) ratio is a simple but popular metric used by investors and institutions to determine the relative value of a company’s stock.
Here, “price” means current price per share of a stock, and “earnings” means a company's profit per share over a specific period of time (usually a year).
In other words, a company's P/E ratio is how much investors pay per dollar of annual company earnings. If a company's P/E ratio is 10, that means its shares cost 10 times the profit it makes on a per-share basis in a year.
How to Calculate P/E Ratio
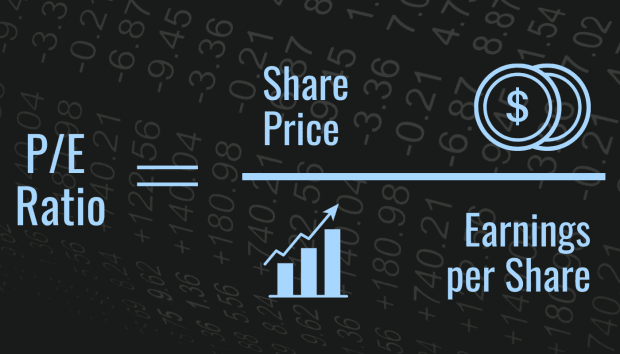
The equation for the price-to-earnings ratio looks like this:
P/E = Share Price/Earnings per Share
To calculate a company's P/E ratio, divide the price of one share of that company's stock by the earnings per share (often abbreviated EPS) of that company’s stock over a period of 12 months. A company’s P/E ratio is usually expressed in terms of x, which simply means “times.” For instance, a P/E ratio of 5x means that a company’s stock price is five times its annual earnings per share.
Alternatively, P/E can be calculated by dividing market capitalization (instead of share price) by total annual earnings (instead of earnings per share). Market capitalization is the total value of all outstanding shares of a company's stock.
P/E Ratio Example
So, if a fictional company called Acme Adhesives currently trades at $100 per share, and the company earns $25 of profit per share of stock over 12 months, then Acme’s P/E ratio is 100/25, or 4x. This means that Acme’s stock price is four times its annual earnings per share.
Another way to conceptualize a company’s P/E ratio is to think of it as the price investors pay for $1 of company earnings per year. Using the example above, a new investor might expect Acme to earn $1 per year for every $4 they invest.
Why Are P/E Ratios Useful?
Since every stock has a different price, a different number of shares in circulation, and different earnings, looking at them in terms of their P/E ratios makes them more easily comparable. In other words, the P/E ratio works as sort of a common language through which to evaluate stocks that might otherwise be difficult to compare.
By looking at the P/E ratios of various companies across an industry—all of which have a different number of shares, a different market price, and different earnings—an investor might be able to get a better idea of which companies have recently provided higher returns to their investors.
That being said, P/E ratios are by no means the primary indicator of whether a stock will perform well over time. The market is extremely complex, and no one metric rules them all. P/E ratios simply provide one of many useful tools that an intelligent investor can incorporate into their toolkit as they attempt to evaluate stocks and refine their investment strategy.
What Are P/E Ratios Used For?
P/E ratios are used to understand the value or worth of a company’s stock compared to other, similar stocks or to the market as a whole as estimated by stock indices like the S&P 500. P/E ratios can also be used to compare a stock’s current value to its past value or projected future value.
One investor might compare the P/E ratios of multiple companies in a particular industry or sector that they’re interested in in order to determine which one has the lowest ratio and therefore might be the most undervalued. Another investor might compare the P/E ratio of a stock they’re considering buying to that of their preferred index to try to gauge its value relative to the market as a whole. An investor interested in short selling might look for companies with high P/E ratios but whose fundamentals don’t seem particularly strong and bet on their prices going down over time.
It’s important to keep in mind that different companies make money in different ways and at different rates, so the more similar two companies are, the more insight their P/E ratios are likely to provide when compared. For instance, a technology company and a transportation company are so dissimilar that comparing their P/E ratios alone probably isn’t the best strategy for determining which company is a better buy.
What Are the 3 Types of P/E Ratios?
While all P/E ratios represent a stock’s price divided by its 12-month earnings (increase in value), there are three different types of P/E ratios, and each is calculated based on a different period of earnings.
1. Trailing Price-to-Earnings
Trailing P/E ratios divide the current share price by the most recently available 12 months of earnings per share. (Earnings per share are typically reported quarterly.)
Past earnings, so long as they are truthfully reported, are not disputable because they’ve already occurred. For this reason, trailing P/E ratios are popular with investors who prefer not to rely on companies’ projections about their future earnings.
While trailing P/E ratios offer the most objectivity, they do have downsides. For one, past performance is not necessarily predictive of future success. Second, stock prices fluctuate daily, but trailing earnings per share can usually only be updated quarterly (when they are released), so trailing P/E ratios can change quickly with stock price and become more out of date the longer it’s been since the latest quarterly earnings were released.
How to Calculate a Trailing P/E Ratio
Acme earned $5 per share of stock over the last 12 months, and the current share price is $105.
Trailing P/E = current price per share / earnings per share over past 12 months
Trailing P/E = $105 / $5
Trailing P/E = 21x
2. Forward (AKA Leading or Estimated) Price-to-Earnings
Forward P/E ratios divide the current share price by future EPS as estimated by a company’s earnings guidance. This can be helpful to investors in that it can give them an idea as to how future earnings might compare to current quarter earnings and past earnings. In other words, it is often used in conjunction with the trailing P/E ratio to identify longer-term trends and make predictions.
While useful for analysis, predictions, and trend-mapping, forward P/E ratios are inherently subjective and entirely predictive since they rely on earnings that have yet to occur and are estimated internally rather than by a third party. Purposeful or accidental over or underestimations of future earnings can occur.
How to Calculate a Forward P/E Ratio
Acme predicts that it will earn $7 per share over the next 12 months, and the current share price is $105.
Forward P/E = current price per share / projected earnings per share over next 12 months
Forward P/E = $105 / $7
Forward P/E = 15x
3. Hybrid (AKA Current) Price-to-Earnings
Rather than utilizing solely past earnings or projected future earnings, hybrid P/E ratios use both. Hybrid P/E ratios are calculated by dividing the current share price by the sum of the previous two quarters’ actual earnings and the projected earnings for the next two quarters. In this way, the denominator in the equation consists of six months of real, past data, and six months of projected future data.
Since hybrid P/E ratios combine elements of both trailing and forward ratios, some investors think they strike a healthy balance between accurate but potentially outdated information and subjectively predicted estimations about future earnings.
How to Calculate a Hybrid P/E Ratio
Acme’s earned $2.50 per share over the last 12 months and the company projects that it will earn $3.50 per share over the next 6 months. The current share price is $105.
Hybrid P/E = current price per share / (6-month trailing EPS + 6-month projected EPS)
Hybrid P/E = $105 / ($2.50 + $3.50)
Hybrid P/E = $105 / 6
Hybrid P/E = 17.5x
What Do High and Low P/E Ratios Mean?
A high P/E ratio indicates one of two things—either a company’s stock is overvalued by the market, or the market expects it to perform well in the future. A low P/E ratio also indicates one of two things—either a company’s stock is undervalued by the market, or the market expects it to perform poorly in the future.
For any given P/E ratio, different analysts might offer different explanations. One analyst might take a high ratio (along with other relevant data) to mean that a company is overvalued, while another might interpret the same metric (along with other relevant data) to mean the company is slated for success.
Analysts’ views often differ because they place different amounts of significance on various factors in different situations. Each investor must decide for themself how to interpret P/E ratios and other metrics when evaluating stocks according to their own strategy or ruleset.
Frequently Asked Questions (FAQ)
Below are answers to some of the most common questions investors ask about price-to-earnings ratios.
Is a Lower P/E Ratio Better Than a Higher One?
While it is true that lower P/E ratios translate to higher earnings per dollar spent (during the period in question), stocks with lower P/E ratios are not always better investments than stocks with higher ones.
As mentioned above, average P/E ratios vary wildly between industries, and older, more established companies tend to have lower ratios than newer, up-and-coming companies that are in growth phases and have high costs. Stocks with low forward P/E ratios may not always perform as well as projected.
Depending on an individual’s investment strategy, low P/E ratios may or may not be important indicators when it comes to picking stocks successfully.
What Is the Best P/E Ratio?
There is no best P/E ratio, and average P/E ratios vary across industries. It’s important to remember that a company can have a high P/E ratio because it is overvalued, but it can also have a high ratio because investors and/or analysts think it has major future earnings potential.
Older companies that have had consistently low P/E ratios over long periods of time may appeal to risk-averse investors seeking modest but consistent returns. Newer companies with low or non-existent P/E ratios that are experiencing growth may appeal to investors with higher risk tolerance who are seeking larger returns.
What Is an Average or “Normal” P/E Ratio?
As mentioned above, average P/E ratio varies quite a lot between industries, so there is really no “normal” ratio. That’s one of many reasons why context is so important when considering this metric. Additionally, a company’s age should be taken into consideration when evaluating its P/E ratio. Well-established companies that have been around for some time may have lower P/E ratios than newer companies in the same industry. NYU maintains a page that lists average P/E ratios by industry.
Can a Stock Have a Negative P/E Ratio (or a Ratio of 0)?
Since 0 cannot serve as the denominator in any fraction, a company cannot have a P/E ratio of zero. A negative P/E ratio would indicate a loss (instead of earnings) over the 12-month period in question. In most cases, however, companies that experience losses do not report a negative P/E ratio; instead, they may list their earnings as “N/A” (not applicable).
Negative earnings are not uncommon, especially in newer companies that are in a phase of growth. A consistently negative P/E ratio over a long period of time, however, might indicate that a company is headed toward bankruptcy.