Surging global tourism emissions are driven almost entirely by 20 countries, and efforts to rein in the trend aren’t working.
That is the main finding of our new research, published in Nature Communications today. It represents the most rigorous and comprehensive analysis of tourism emissions yet conducted.
The study draws together multiple datasets, including those published directly by 175 governments over 11 years (2009-2020). It uses the United Nations-endorsed “measurement of sustainable tourism” framework and draws on tourism expenditure and emissions intensity data from national accounts.
The findings reveal serious challenges ahead, given the wider context. The UN Environment Programme reports a 42% reduction in current global emissions overall is needed by 2030 (and 57% by 2035). If not, the Paris Agreement goal of limiting warming to 1.5 degrees will be lost.
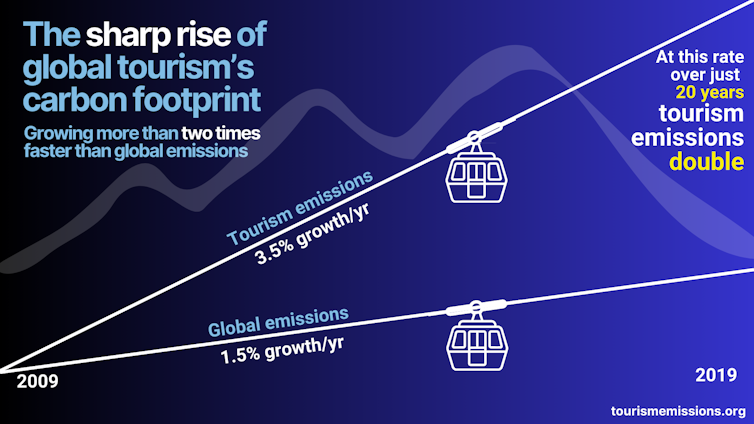
But global tourism emissions have been growing at double the rate of the global economy. Our study reveals that between 2009 and 2019, emissions increased by 40%, from 3.7 gigatonnes (7.3% of global emissions) in 2009 to 5.2 gigatonnes (8.8% of global emissions) in 2019.
While global tourism emissions fell dramatically in 2020-2021 due to COVID-19, the rebound to pre-pandemic levels has been rapid.

Massive growth without a technological fix
Tourism-related emissions increased at a yearly rate of 3.5% from 2009 to 2019. By comparison, global economic growth in general over that period was 1.5% per annum. If this growth rate continues, global tourism emissions will double over the next two decades.
The carbon intensity of every dollar of tourist spending is 30% higher than the average for the global economy, and four times higher than the service sector.
The primary driver of rising emissions is high growth in tourism demand. The rapidly expanding carbon footprint is predominantly from aviation (21%), use of vehicles powered by petrol and diesel (17%), and utilities such as electricity supply (16%).
Slow efficiency gains through technology have been overwhelmed by this growth in demand.
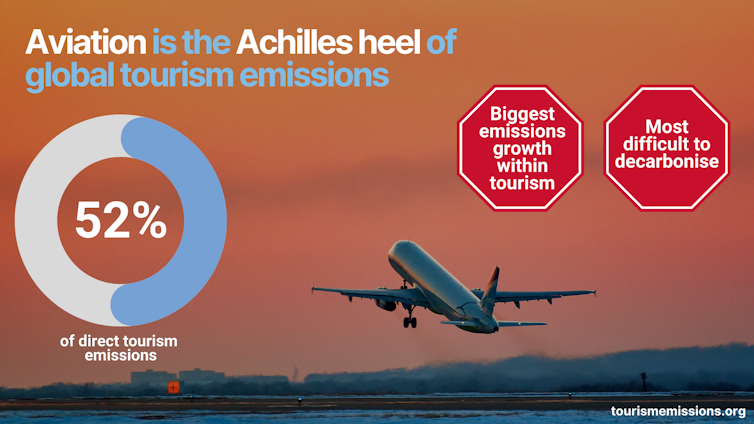
Aviation accounted for half of direct tourism emissions, making it the Achilles heel of global tourism emissions. Despite decades of promises, the global air transport system has proved impossible to decarbonise through new technologies.

20 countries dominate emissions
Our research revealed alarming inequalities in emissions growth between countries. The United States, China and India accounted for 60% of the growth in tourism emissions between 2009 and 2019. By 2019, these three countries alone were responsible for 39% of total global tourism emissions.
Three-quarters of total global tourism emissions are produced by just 20 countries, with the remaining 25% shared between 155. Remarkably, there is now a hundred-fold difference in per-capta tourism footprints between countries which travel most and those which travel least.
Of the top 20, the US (as a foreign destination, as well as its citizens travelling) had the largest tourism carbon footprint in 2019 – nearly 1 gigatonne. It was responsible for 19% of the total global tourism carbon footprint, growing at an annual rate of 3.2%.
In 2019, the US tourism carbon footprint was equivalent to 3 tonnes per resident, ranking 12th globally among countries with the highest per-capita tourism emissions.
As a destination, the United Kingdom ranked 7th globally, at 128 megatonnes (2.5% of the total). In 2019, UK residents produced 2.8 tonnes of emissions per person, ranked 15th globally.
Australia’s tourism carbon footprint ranked 14th globally (82 megatonnes). Its resident per-capita tourism carbon footprint in 2019 was 3.4 tonnes (8th globally). This underscores the high emissions being driven by long-haul air travel for inbound and outbound international trips.
In 2019, New Zealand’s per-capita tourism carbon footprint was 3.1 tonnes per resident (10th globally). Like Australia, dependence on long-haul international travel is a problem that cannot be ignored.

4 pathways to decarbonising tourism
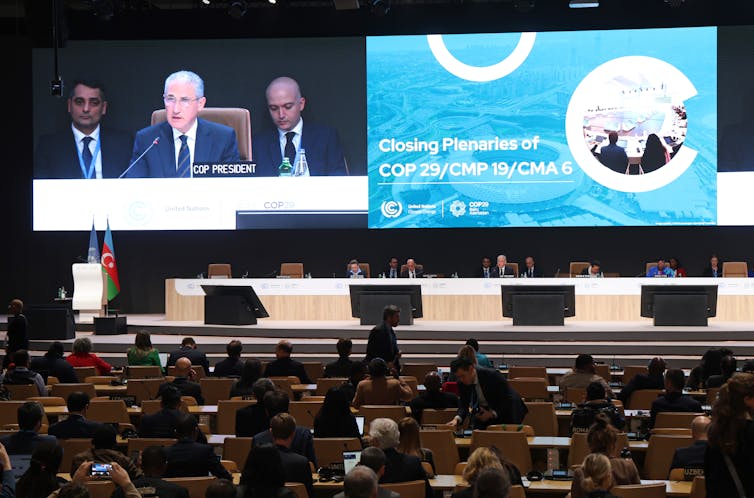
For the first time ever, this year’s UN Climate Change Conference of the Parties (COP29) included tourism. UN Tourism endorsed our study and acknowledged tourism now contributes 8.8% of total global emissions.
It reported that COP29 “marks a turning point, when ambition meets action, and vision transforms into commitment […] to positive transformation for a better future for our planet”.
But our research shows the combination of tourism demand growth on one hand, and the failure of technology efficiency gains on the other, present enormous barriers to tourism carbon mitigation.
Despite this, we have identified four pathways towards stabilising and reducing global tourism emissions:
Measure tourism carbon emissions to identify hotspots. Our research provides evidence of the tourism sub-sectors driving high emissions growth, including aviation, energy supply and vehicle use. These hotspots must move onto a 10% annual emissions reduction pathway to 2050.
Avoid excessive tourism development and identify sustainable growth thresholds. National tourism decarbonisation strategies must now define and implement sustainable growth goals, most urgently in the 20 highest-emitting tourism destinations.
Shift focus to domestic and short-range markets, and discourage long-haul markets. Actively managing growth in demand for air travel is the most obvious first step, which might involve regulating long-haul air travel demand.
Address inequality between countries by factoring in the social costs of carbon emissions. Controlling current patterns of relentless growth in long-haul air travel aligns with a more socially equitable approach to tourism, which is needed to address these inequalities.
The fundamental purpose of our research is to give policymakers and industry leaders greater clarity about tourism’s impact on global emissions. The challenge then is to develop evidence-based policy and regulation to achieve urgent tourism decarbonisation.
The authors acknowledge the contributions of Stefan Gössling, Manfred Lenzen and Futu Faturay who were part of the research team on this project, and who coauthored the Nature Communications paper on which this article is based.
James Higham receives funding from the NZ Ministry of Business, Innovation and Employment Endeavour Programme.
Ya-Yen Sun receives funding from the Australian Research Council to support this project.
This article was originally published on The Conversation. Read the original article.


