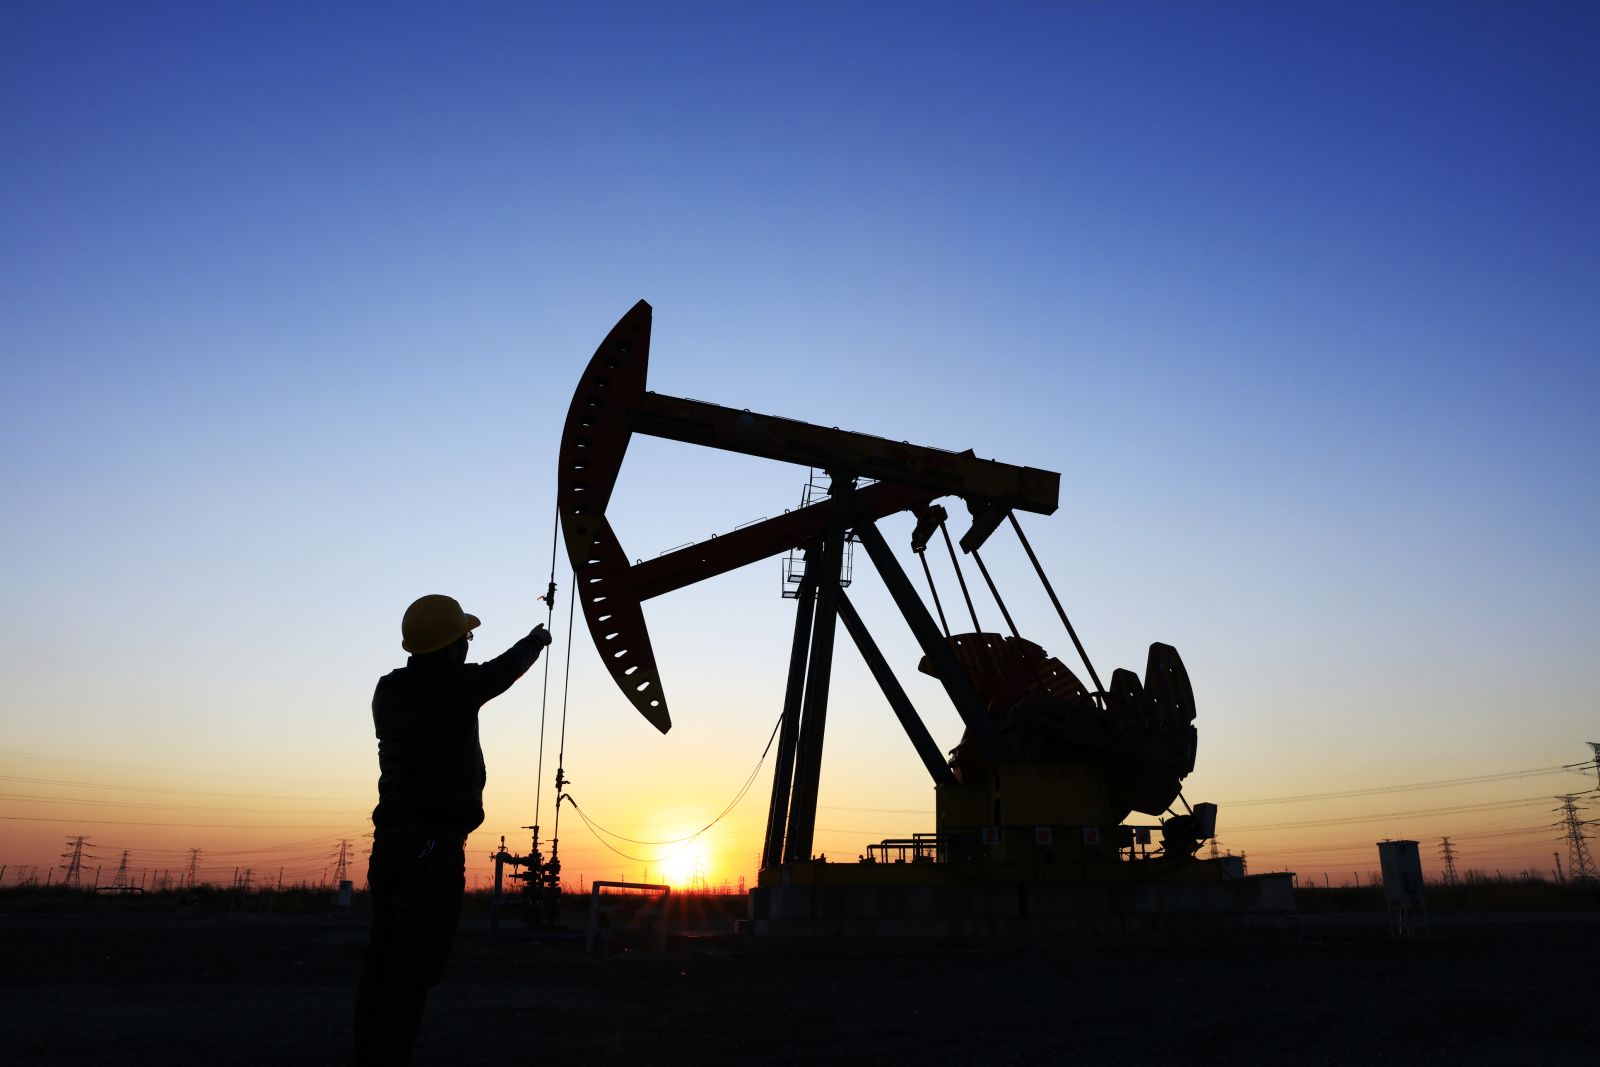
After a volatile week in crude oil futures, Friday saw slightly higher prices at the close. However, for the week, crude oil fell for the second time in two weeks. Two nuclear-armed countries fired missiles and drones upon each other for the first time in history. The US will be placing sanctions on Iran's oil. The EU is considering similar actions. These events typically would be bullish for energy prices.
What does this recent price action tell us about its direction?
Crude oil has been in a seasonal uptrend since December that typically ends near the beginning of May. In an article for Barchart, "Has Crude Oil Put in an Early Seasonal Low?" I wrote, "In the United States, the summer months, beginning in May, typically see increased demand for gasoline as people take vacations and drive more. While the gasoline demand appears in May, refiners must begin purchasing crude oil in January to allow time to refine and deliver the gasoline."

Source: Barchart
The weekly crude oil chart above shows the seasonal low came in mid-December and has had a steady rally into the end of April. Early May typically ends the most pronounced seasonal trend in the crude oil market. From here, there are two seasonal pattern timeframes, the 5-year and 15-year, which we will discuss to see which way crude oil may move in the upcoming months.
United States Strategic Petroleum Reserve Crude Oil Stocks

Source: EIA
The recent seasonal rally received support from the US government, which needed to replenish the Strategic Petroleum Reserves (SPRs), which had been depleted to significantly low levels. In January 2021, with levels at 638K, the US Administration began selling SPRs to battle higher oil prices. They continued to do this until August 2023, when the SPR inventory was 348K, reducing the nation's SPRs to dangerously low levels. This was the lowest inventory level since February 1984.
Since January 2024, the SPRs have been aggressively replenished weekly. As of the recent purchase, March 29, the SPR levels have only increased to 364K from the August lows of 348 K. More buying is needed to return to January 2021 levels of 638 K.
The Disaggregated COT Report
Refiners continued to buy crude oil (blue lines) since the December seasonal low, albeit not at the quantity they had been. The price of crude oil (yellow line) shows the bullish interest refiners (blue lines) have had since early December.
The graph below shows the crude oil uptrend is still in solid hands. But will the refiners continue buying after early May?

Source: CMEGroup Exchange
Daily Crude Oil Chart

Source: Barchart
The daily crude oil chart shows two significant dates with red arrows. The first one was the day Iran attacked Israel on a Saturday when the markets were closed. The first day to react would have been Sunday night's opening. The following red arrow was the night Israel retaliated, and Iran played down the attack in a press conference. These events would have usually caused oil prices to rise much higher.
Seasonal Patterns
Seasonal patterns do change over time due to a multitude of reasons. Usually, it's a fundamental event that impacts the supply and demand of a product. As these changes occur, they typically appear in the shorter duration seasonal patterns first. Moore Research Center, Inc. (MRCI) uses 5, 15, and 30 analysis periods. Crude oil has a different seasonal pattern in the five years than in the 15 years.

Source: MRCI
The more popular period, 15 years, shows how the December seasonal rally generally terminates in early May each year. Then, the market trades in an extensive sideways range until October, when the Environmental Protection Agency (EPA) allows refiners to make a winter gasoline blend, resulting in lower prices into year-end.
This might be a typical pattern if we didn't have the geopolitical events with Iran and Israel contributing to a possible war premium built into prices.

Source: MRCI
The 5-year research by MRCI shows a different seasonal pattern for crude oil. You will notice a slight correction after the May period. However, the prices continue to grind higher, first into the US Independence holiday weekend period in early July, when gasoline demand will increase again. After a slight pullback, the price grinds higher into the Labor Day holiday weekend in early September, when the last weekend of summer vacations creates more gasoline demand again.
Some reasons the crude oil market may play out to the 5-year seasonal pattern this year:
- OPEC is still holding to their oil production cuts. Some speculate that they will begin producing more oil in July.
- The geopolitical events in the Middle East added a war premium to crude oil prices.
- The US economy is still seeing substantial employment and wage increases, possibly creating more vacation time this Summer.
- The daily chart trend is still up, showing continued momentum.
In closing
In summary, despite a slight uptick in crude oil prices at the close of a volatile week, the market experienced its second consecutive weekly decline. Unprecedented missile and drone exchanges between nuclear-armed nations, coupled with impending US sanctions on Iran's oil exports and similar considerations by the EU, typically suggest bullish prospects for energy prices. However, 15-year seasonal trends indicate a potential shift, with the typical uptrend from December to May nearing its end. The recent rally, supported by US government actions to replenish depleted Strategic Petroleum Reserves, highlights ongoing market dynamics. While refiners have shown continued interest in purchasing crude oil, geopolitical tensions, and evolving economic factors may shape future price movements. As we navigate these complexities, monitoring the 5-year shorter-term seasonal patterns alongside geopolitical developments will be crucial in understanding the direction of crude oil markets in the coming months.
More Stock Market News from Barchart
- Tech Earnings, Middle East Tension and Other Key Things to Watch This Week
- Nvidia Stock Looks Too Cheap Here - Put Premiums are Very High and Worth Shorting
- 3 Cathie Wood Stocks Analysts Like Better Than Tesla
- Down 22% YTD, Should You Buy the Dip in Adobe Stock?