After bank earnings started rolling in yesterday, Wells Fargo (WFC) and Citigroup (C) added to the mix on Friday.
For its part, Wells Fargo stock was up 6.2% despite missing on earnings and revenue estimates, while Citigroup delivered the group’s first meaningful top- and bottom-line beat of the season.
Its reward? A 13% rally.
JPMorgan (JPM) shares were up 4.6% on the day and hit our first upside target after the shares dipped following a top- and bottom-line miss.
Morgan Stanley (MS) stock also reported a profit and revenue miss.
So far, the banks are telling investors a mixed story.
Trading Wells Fargo Stock
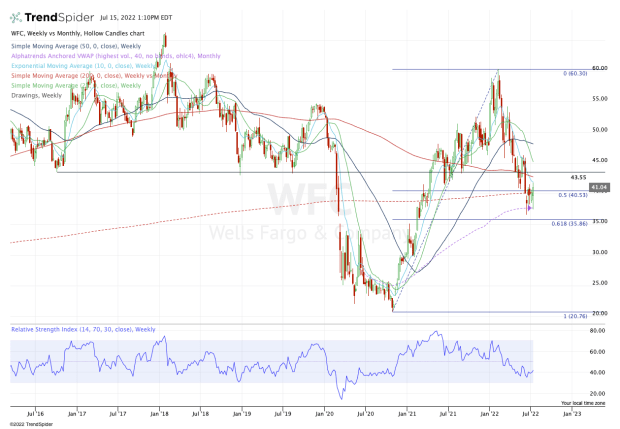
Chart courtesy of TrendSpider.com
There’s no other way to put it: Wells Fargo's chart is messy.
But if this group of stocks can find a way to rally on disappointing earnings, that’s a bullish development.
For a sustainable rally in Wells Fargo though, it has quite a few levels to clear. That begins with the 10-week moving average, which has been active support for months now.
Above that opens the door to the 200-week moving average and the key $43.50 level. Above $43.50 and bulls could see $45 next, followed by the 50-week moving average and $50.
Should the rally lose steam, keep an eye on $37 to $37.50 and the monthly VWAP measure. These marks have been support thus far, but if they fail, it could put the $33.50 to $35 area in play.
That was the breakout level post-Covid and the 61.8% retracement.
Citigroup Stock Has 3 Upside Targets to Watch
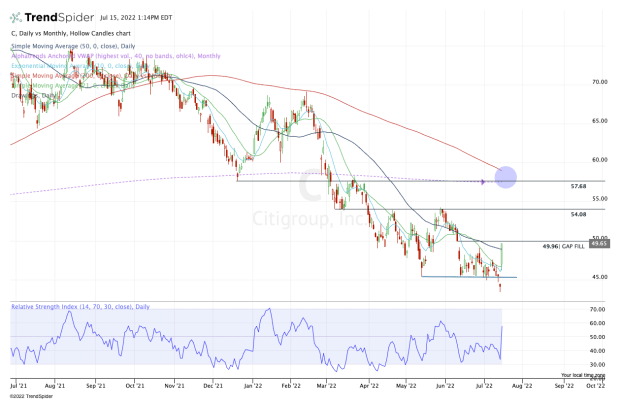
Chart courtesy of TrendSpider.com
Thankfully, Citigroup has a cleaner look than Wells Fargo — and its post-earnings rally of 13% is the cherry on top.
On Thursday, Citigroup closed below $45.50 support on the not-so-hot reports from JPMorgan and Morgan Stanley. On Friday, though, the shares opened above the 10-day and 21-day moving averages and have gone on to reclaim the 50-day.
Now three levels loom very clearly on the charts:
- The $50 level, which is the gap-fill from June. Citi finished Friday just 2 cents short of this point.
- The $54 level, which was support in Q1 but resistance in Q2.
- The $57.50 level, which is the December low and Q1 resistance, and is near the declining 200-day moving average and the monthly VWAP measure.
If Citigroup stock can’t get above and stay above $50, the bulls should be cautious in the intermediate term. If it gets above $50, the bulls can turn their attention to the next upside level, which is $54.
.png?w=600)