On Thursday evening, Benzinga Pro asked its followers on Twitter Inc (NYSE:TWTR) what they were buying at the open on Friday. From the replies, Benzinga selected one ticker for technical analysis.
@captain_gsb_179 and @Dirkdiggler7241 are buying Sundial Growers Inc (NASDAQ:SNDL).
On Thursday, stocks in the cannabis sector were on fire after a report surfaced indicating the U.S. House Rules Committee has scheduled a meeting for Monday in preparation to bring the Marijuana Opportunity, Reinvestment and Expungement (MORE) Act to the floor for a vote.
The news brought back to life the withered cannabis sector, which has been in a mostly years-long downtrend with the exception of the occasional short squeeze.
Sundial, a short squeeze target a few times in 2021, shot up 23% on the news and in the premarket on Friday, the stock was soaring an additional 15% higher.
The Alberta-based cannabis company has a fairly high amount of short interest with 228.89 million, meaning 11.11%, of its 2.06 billion float is held short.
See Also: Why Sundial Shares Are Trading Higher After Hours
The Sundial Chart: On March 14 and March 15, Sundial printed a bullish double bottom pattern at the 45-cent level and over the following seven trading days, the stock has soared up 65%. Sundial has not confirmed it’s trading in an uptrend, because the stock has not yet printed a higher low.
Eventually, the stock will need to pull back to print the higher low because it is becoming over-extended. Bullish traders who are not already in a position could watch for a reversal candlestick, such as a hammer or doji, to form on the pullback for a solid entry.
Sundial’s relative strength index (RSI), indicates that pullback may come over the next few trading days because the oscillator is measuring in at about 78%. When the RSI reaches or exceeds the 70% level, it becomes overbought, which can be a sell signal for technical traders.
The move higher on Thursday came on massive volume, with over 352 million shares exchanging hands compared to the 10-day average of 87.45 million. Higher-than-average volume indicates there is a high amount of trader and investor interest.
Sundial is trading above the eight-day and 21-day exponential moving averages (EMAs), with the eight-day EMA trending above the 21-day, both of which are bullish indicators. On Thursday, the stock gained support at the 200-day simple moving average (SMA), which indicates long-term sentiment has turned bullish. If the stock is able to hold above the 200-day SMA for a period time, the 50-day SMA will cross above it, which will cause a golden cross to occur.
Want direct analysis? Find me in the BZ Pro lounge! Click here for a free trial.
- Bulls want to see sustained big bullish volume hold the stock above the 200-day SMA and then for eventual consolidation to allow the RSI to cool off. Sundial has resistance above at 78 cents and the 84-cent marks.
- Bears can look for a short-term trade when a volume climax takes place, indicating the bulls have become exhausted and have begun to take profits. There is support below at 72 cents and the 64-cent levels.
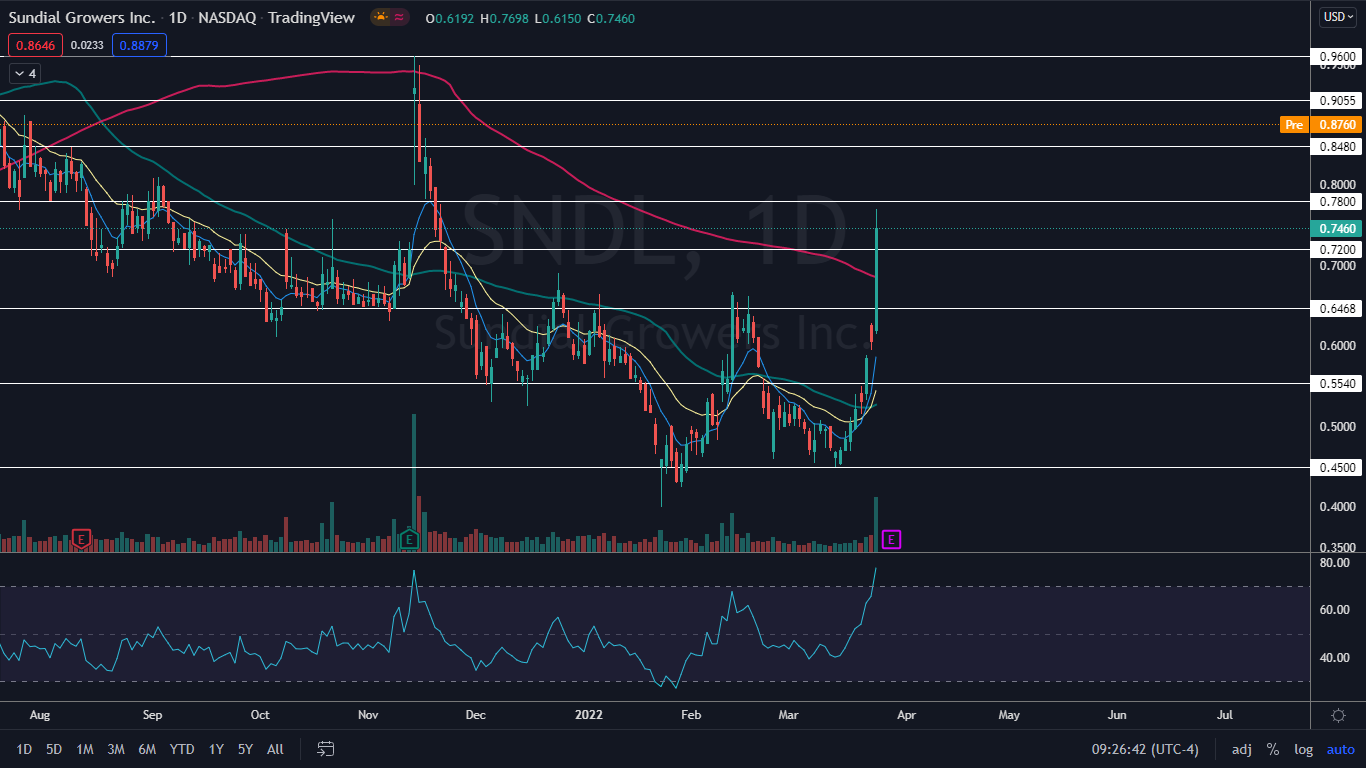
Photo by Giorgio Trovato on Unsplash