
As of Friday’s close, The Dow Jones Industrial Average Index had soared 14.44% off the Sept. 30 closing price, putting it on track for its best month since November 1928, when the Dow gained 16.35% over the close in October of that year.
The Dow’s monthly performance was tied on Friday with January 1976, when it rallied 14.41% over the December 1975 closing price.
Read more about the Dow's historic gains here.
On Friday alone, the Dow surged 2.59%, and if it’s able to make a similar percentage gain on Monday to close out the month, the Dow would be tied with a record made in June 1931, when it closed up 16.91%.
The Dow opened slightly lower Monday, back testing the 200-day simple moving average as support to put it up about 14% above September’s close. If the Dow closes the trading day near to flat, it will be the largest monthly gain since January 1975, when it posted gains of 14.19% over the December 1974 closing price.
If the Dow closes out the month under about $32,690, it will still be the largest percentage gain since January 1987, when the Dow closed the month up 13.82%.
The ETF is comprised of 30 prominent companies, and UnitedHealth Group, Inc (NYE: UNH) and Goldman Sachs (NYSE:GS) are the two most heavily weighted holdings within the Dow, making up 11.05% and 6.85% of the index, respectively.
The Dow (DIA) Daily Chart: The Dow opened with an inside bar pattern Monday, which indicates a period of consolidation may be taking place. Consolidation is needed after four straight weeks of consistent gains.
- The Dow’s inside bar leans bullish because the index was trading higher before forming the pattern and because Monday’s candlestick was printing near the top of Friday’s trading range. Traders and investors can watch for the Dow to break up or down from Friday’s mother bar on higher-than-average volume later on Monday or on Tuesday to assess whether the pattern was recognized.
- If the Dow continues to trend sideways or slightly lower over the coming trading days, a bull flag pattern could print. In that case, the measured move would be about 8.58%, which suggests the ETF could soar up toward $35,200, putting the Dow within about 5% of the Jan. 5 all-time high of $36.952.65.
- On Monday, the Dow was holding above the 200-day simple moving average, which indicates long-term sentiment has turned bullish. After regaining the 200-day SMA on Friday, it’s considered healthy for the Dow to back test the area as support.
- The Dow has resistance above at $33,095.50 and $33,904.69 and support below at $32,325.16 and $31.082.57.
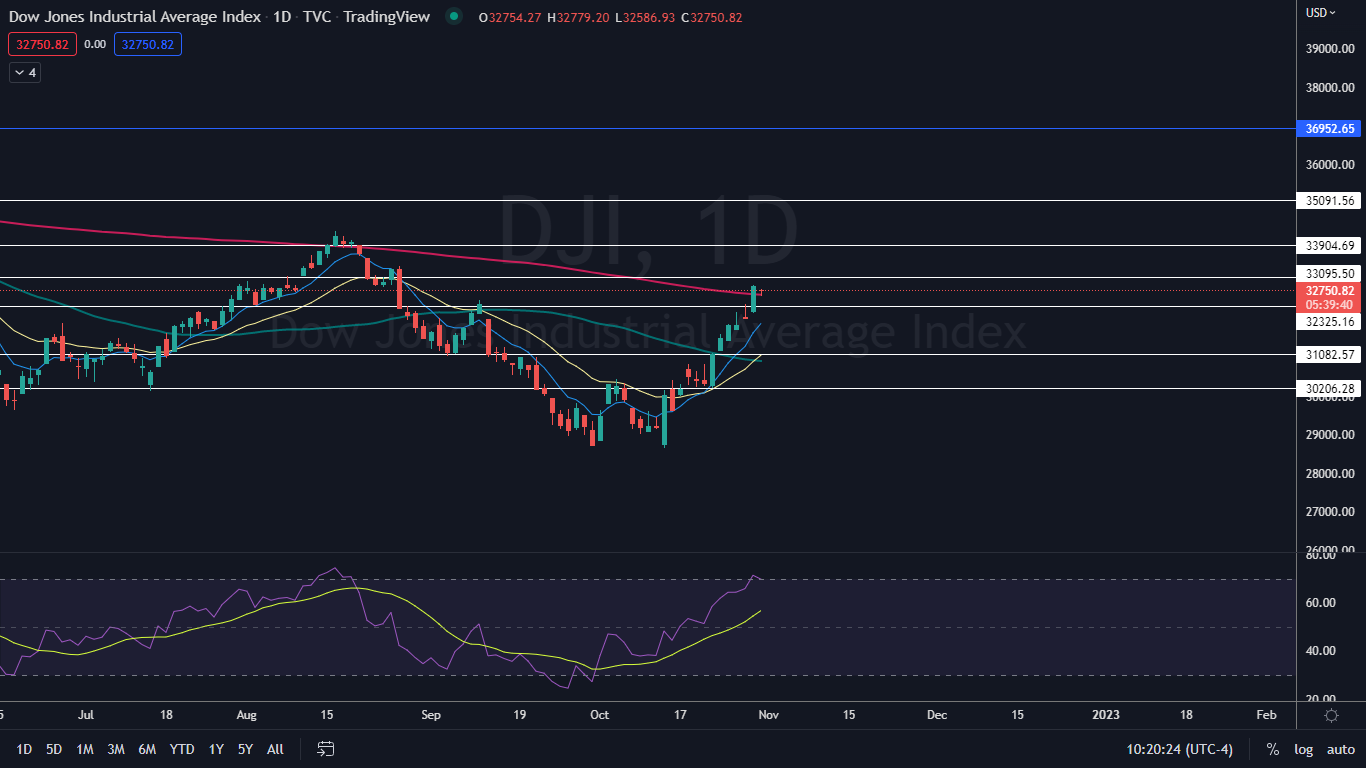
Photo via Shutterstock.