Snap, Inc (NYSE:SNAP) was shooting up about 7% higher at one point on Friday, in tandem with the S&P 500, which was trading higher by 2%.
The bounce came as a relief for traders and investors of Snapchat’s parent company, as the stock has been heavily beaten down for months, plunging 74% from its Sept. 24, 2021 all-time high of $83.34 to reach a 52-week low of $29.95 on Thursday.
Want direct analysis? Find me in the BZ Pro lounge! Click here for a free trial.
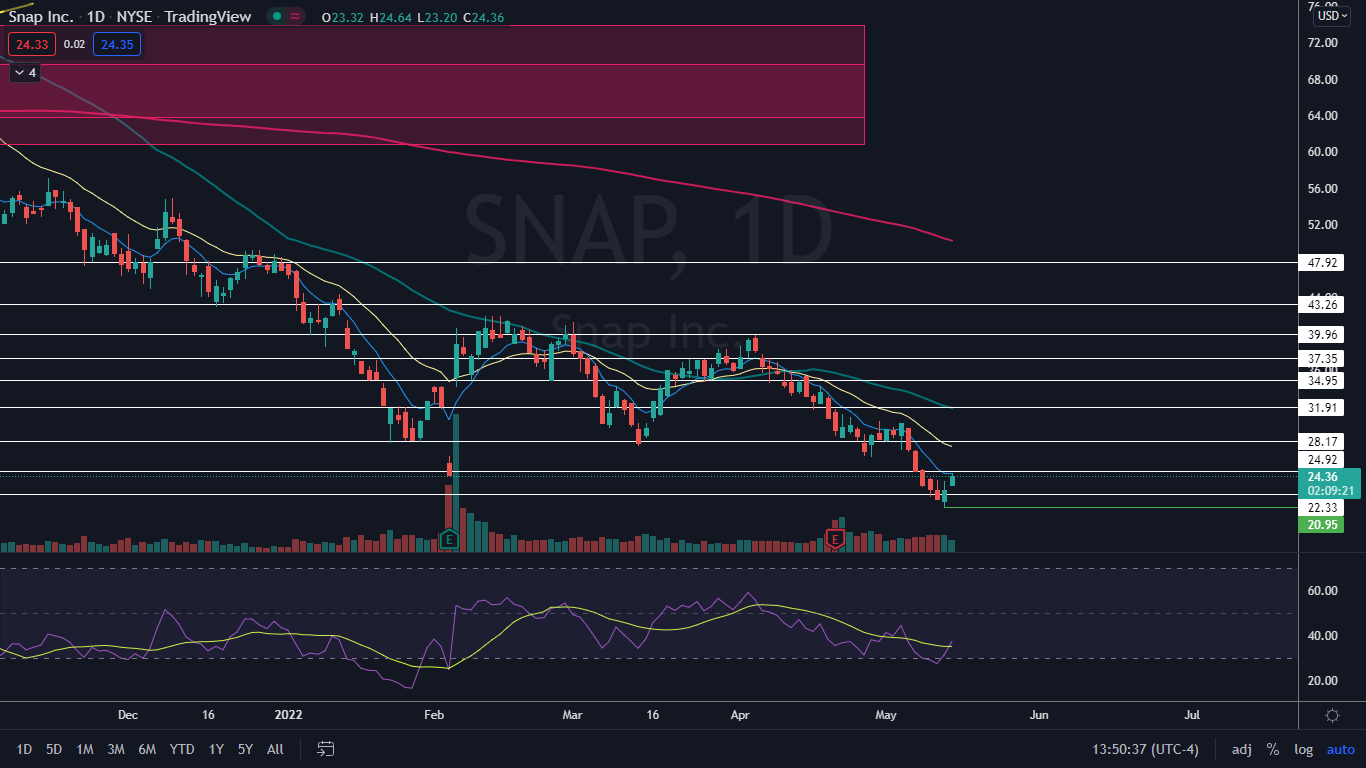
The Snap Chart: Snap has been trading in a steep and fairly consistent downtrend since April 5, declining about 40% since that date. Snap’s most recent lower high was printed on May 4 and $30.19 and the most recent lower low was formed at Thursday’s low-of-day.
- If Snap is going to reverse course into an uptrend, traders and investors can watch for the stock to print a reversal candlestick, such as a doji or hammer candlestick, above the most recent lower low, otherwise Friday’s price action could become the next lower high in the downtrend.
- Technical traders may have anticipated the bounce would come because, on Thursday, Snap’s relative strength index dipped to about 27%. When a stock’s RSI falls below the 30% level it becomes oversold, which can be a buy signal for technical traders.
- If Snap closes the trading session near its high-of-day price, the stock will print a bullish kicker candlestick pattern, which could indicate higher prices will come on Monday. If the stock closes the trading day with a long upper wick, it will print a shooting start candlestick, which could indicate lower prices are in the cards.
- Snap has resistance above at $24.92 and $28.17 and support below at $22.33 and at the 52-week low.

See Also: You Won't Get Your Hands On Snap's Pixy Drones So Easy


