General Motors Company (NYSE:GM) was popping up over 2% higher on Monday, lifted by the S&P 500, which was shooting up about 1.5%.
The legacy-turning-EV automaker had also developed a bullish double bottom pattern on the daily chart, which helped to push the stock upwards.
A double bottom pattern is a reversal indicator that shows a stock has dropped to a key support level, rebounded, back tested the level as support, and is likely to rebound again. It is possible the stock may once again retest the level as support, creating a triple bottom or even quadruple bottom pattern.
The formation is always identified after a security has dropped in price and is at the bottom of a downtrend, whereas a bearish double top pattern is always found in an uptrend. A spike in volume confirms the double bottom pattern was recognized, and subsequent increasing volume may indicate the stock will reverse into an uptrend.
- Aggressive bullish traders may choose to take a position when the stock’s volume spikes after the second retest of the support level. Conservative bullish traders may wait to take a position when the stock’s share price has surpassed the level of the initial rebound (the high before the second bounce from the support level).
- Bearish traders may choose to open a short position if the stock rejects at the level of the first rebound, or if the stock falls beneath the key support level where the double bottom pattern was created.
Want direct analysis? Find me in the BZ Pro lounge! Click here for a free trial.
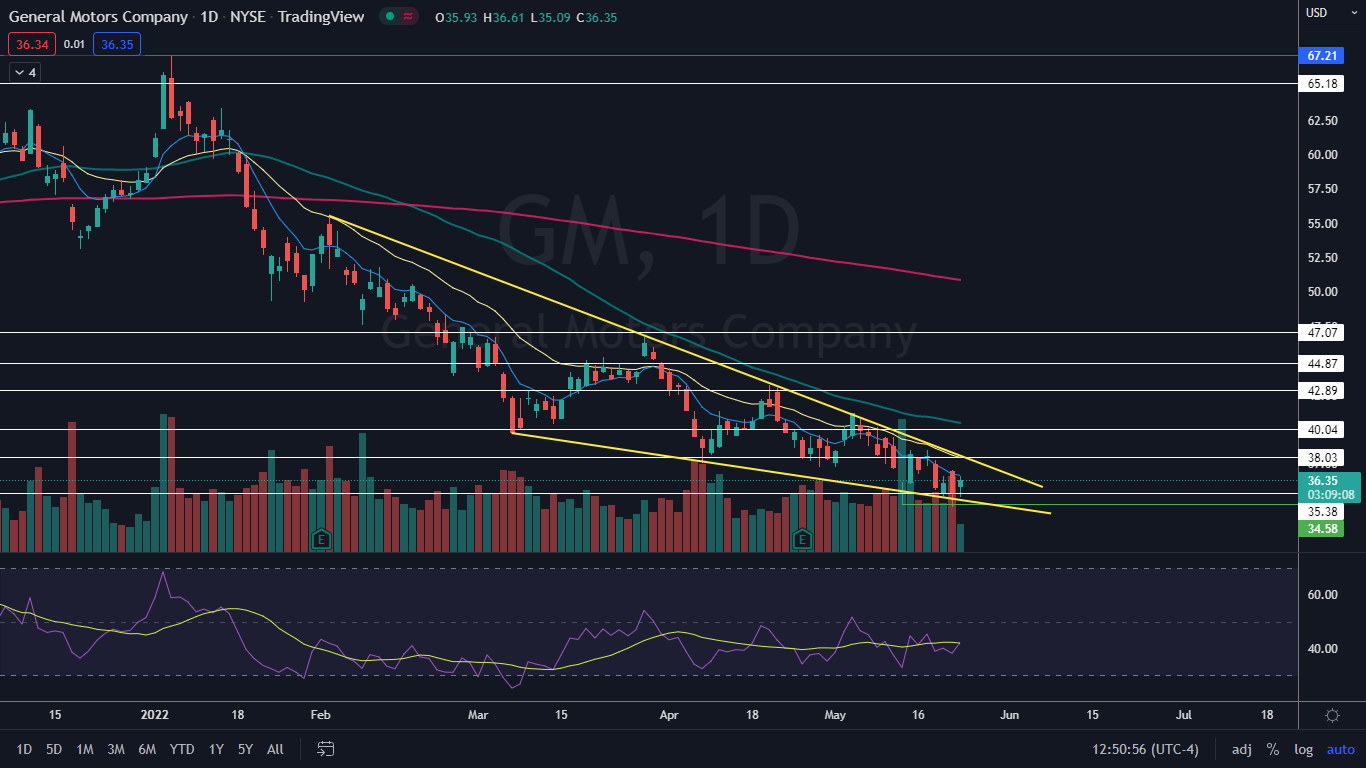
The General Motors Chart: GM printed a double bottom pattern on May 12 and Friday near the $34.58 level. On Monday, the stock was attempting to react bullishly to the formation but rejecting at the eight-day exponential moving average.
- GM has been trading in a consistent downtrend since May 4, when the stock topped out at $41.24. The downtrend is likely to continue unless GM is able to soar up to print a higher high above the most recent lower high of $38.55 or if the stock prints a higher low above the double bottom pattern on the next retracement.
- Bullish traders looking to scalp GM for its run to the next lower high will want to see the stock close the trading day near its high-of-day price, which will cause GM to print a hammer candlestick and indicate higher prices are likely to come on Tuesday. Bearish traders will want to see GM continue to reject the eight-day EMA, which could indicate Monday’s high-of-day is the next lower high within the downtrend.
- GM has resistance above at $38.03 and $40.04 and support below at $35.38 and the double bottom level.