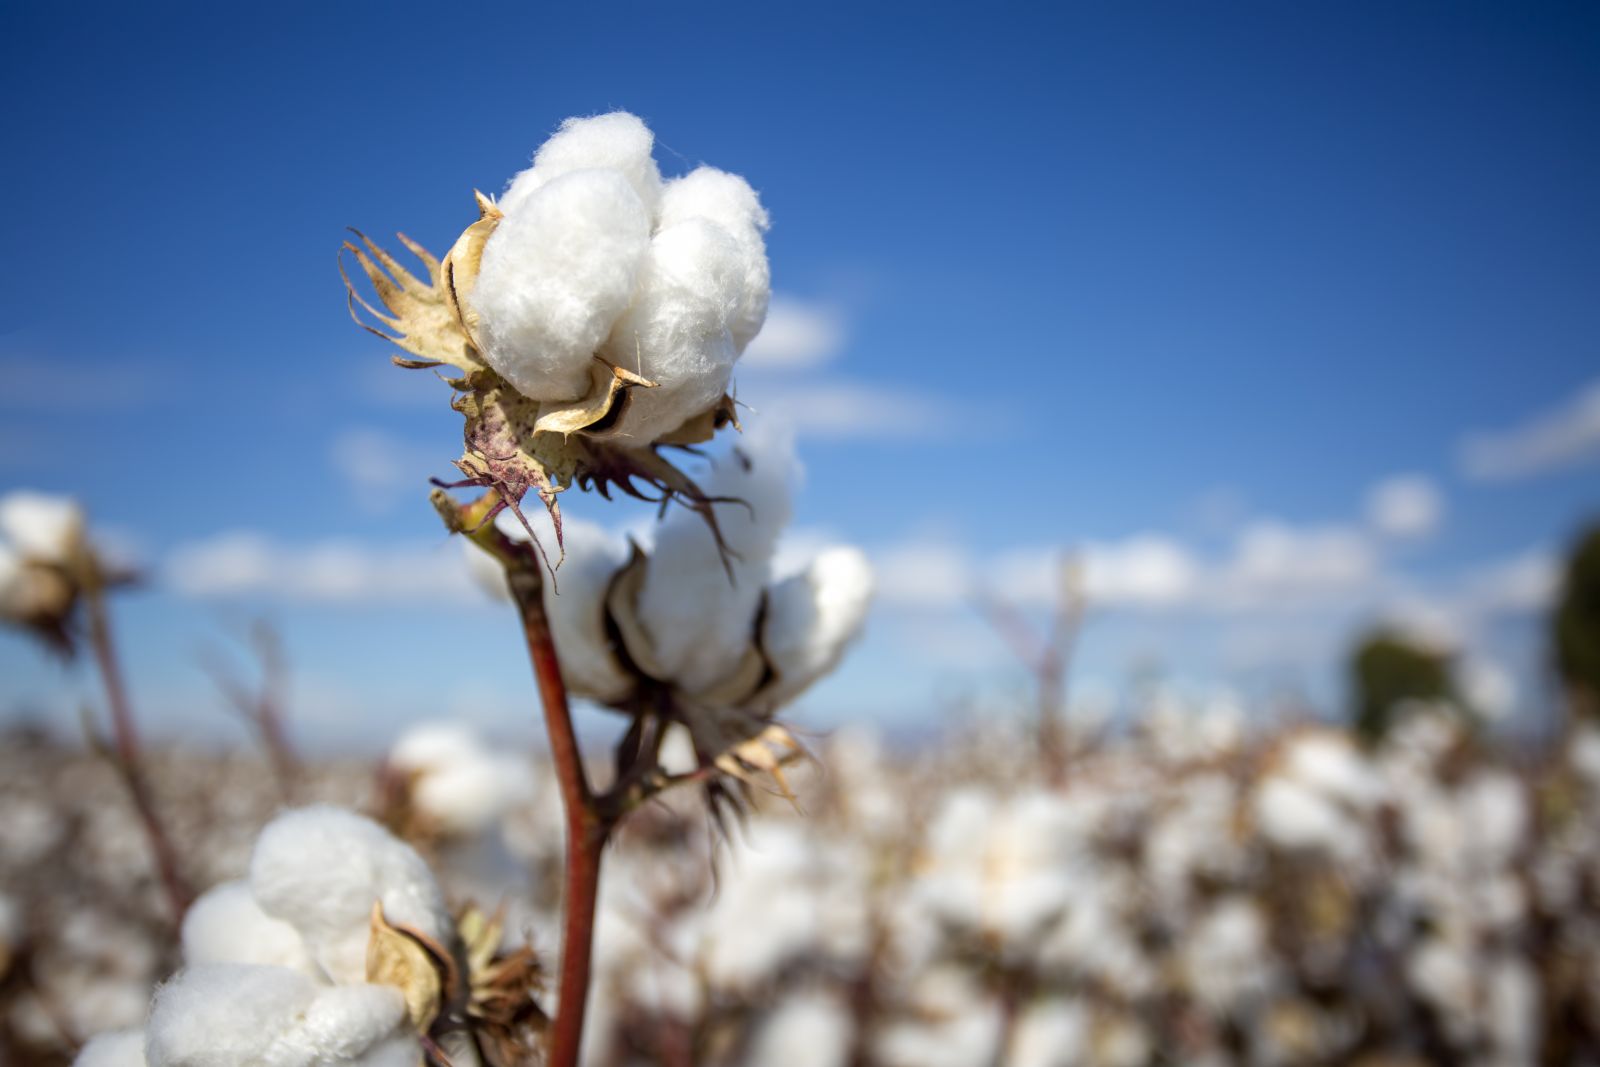
There has been little to write about in the cotton futures market since I last published a Barchart article on May 15 that in Cotton- 80 cents is a Pivot Point. The mid-May 2023 article concluded:
I am not looking for any significant price moves in the cotton market over the coming weeks and months, and I will trade the range, buying when the price drops below 80 cents on a scale-down basis and taking profits when cotton moves away from 80 cents on the upside.
Nearby cotton futures were 82.74 cents per pound on May 15, and the March 2024 contract was just below 81 cents on November 24. With 2024 on the horizon and the bullish price action in the other soft commodities, we could see cotton prices rally as seasonal strength will appear during the first half of next year.
Cotton prices have gone nowhere fast
The weekly ICE cotton futures chart shows the narrow trading range in 2023.

The chart shows the 79.80 to 90.75 cents trading range over the last nearly eleven months. At just under 81 cents per pound on November 24, cotton futures were sitting near the bottom end of a very tight trading range.
Seasonality could impact cotton as spring 2024 approaches
The monthly chart shows that seasonal highs in the cotton futures arena tend to occur during spring.

The monthly chart illustrates that price peaks in 2011, 2014, 2018, and 2022 came in March through May. The spring is when uncertainty over the annual crop reaches a high.
The latest fundamental data for the cotton market came from the USDA’s November World Agricultural Supply and Demand Estimates report.

The WASDE showed that U.S. and global cotton inventories rose from the October report.
Levels to watch in the cotton futures market
As 2023 ends, 80 cents and 90 cents per pound are the technical support and resistance levels. The monthly chart has an upside gap from 98.70 cents to $1.0124 per pound. Long-term technical support is at the 2022 70.21 cents per pound low.
Seasonality is critical in the cotton futures arena. We could get a clue about the path of least resistance of prices in early 2024. Meanwhile, the price action in the other soft commodities continues to favor the upside.
The soft commodities complex says higher
While each soft commodity has individual supply and demand fundamentals and technical paths, the sector has been on bullish fire over the past years. Cotton rose to its highest price since 2011, when it rose to $1.5802 per pound in May 2022. The cotton futures market ran out of upside steam below the record 2011 $2.27 per pound high.
In February 2022, Arabica coffee futures rose to $2.6045 per pound, the highest price since 2011, when they turned lower. However, European Robusta futures reached a record $2,976 per ton in June 2023. World sugar #11 futures reached 28.14 cents per pound in November 2023, the highest price since 2011. Sugar #16 futures rose to a record 45.75 cents per pound in November 2023. In November 2023, nearby ICE cocoa futures moved over the $4,200 per ton level for the first time since 1977. ICE FCOJ futures traded above $4.30 per pound, an all-time high, in October 2023.
The price action in the soft commodities sector could suggest that cotton’s next move is higher.
No ETFs or ETNs- The futures are the only option
Since the BAL ETN product stopped trading in 2023, no ETF or ETN products track cotton prices, leaving the only route for investment or speculative risk positions in the futures market. As of November 22, the total number of open long and short positions in cotton was above 190,000 contracts. Cotton is far more liquid than FCOJ but less liquid than sugar and cocoa. Coffee futures open interest was around the same level.
With cotton consolidating between 80 and 90 cents, it was near the bottom end of its trading range on November 27. If cotton follows the rest of the soft commodities sector, 81 cents per pound could be a bargain for those patient traders and investors looking to take advantage of seasonal strength over the coming months.
On the date of publication, Andrew Hecht did not have (either directly or indirectly) positions in any of the securities mentioned in this article. All information and data in this article is solely for informational purposes. For more information please view the Barchart Disclosure Policy here.


