Sunrun, Inc (NASDAQ:RUN) spiked up over 7% off Tuesday’s closing price on Wednesday morning before being squashed by continued bearish pressure in the general markets, where the S&P 500 over 1% higher before falling off its high-of-day.
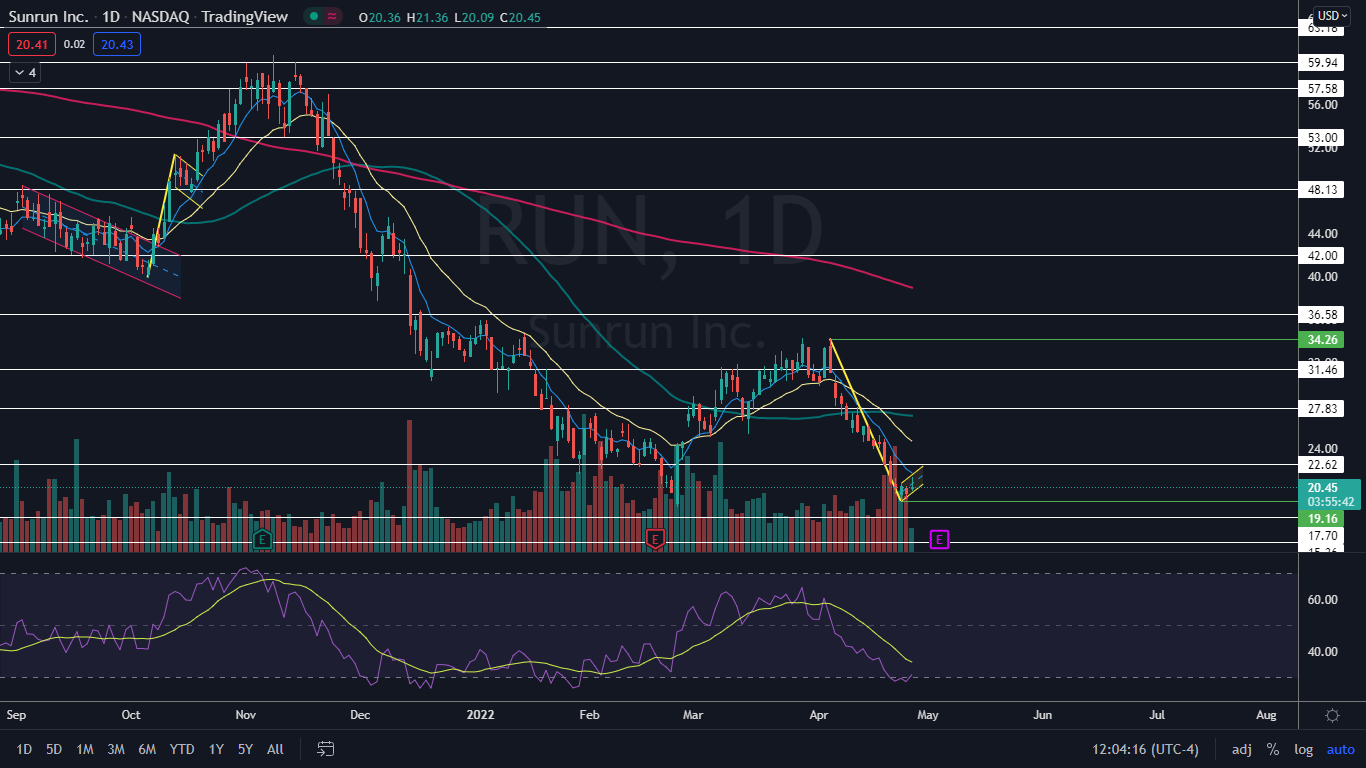
Sunrun has spent the last three trading days consolidating a 42% decline, which brought the stock down from its April 5 high of $34.26 to a low of $19.16, which was printed on Monday. The sharp decline paired with the consolidation has set Sunrun into a bear flag pattern on the daily chart.
The bear flag pattern is created with a steep drop lower forming the pole, which is then followed by a consolidation pattern that brings the stock higher between a channel with parallel lines or into a tightening triangle pattern.
- For bullish traders, the "trend is your friend" (until it's not) and the stock may continue to rise upwards within the following channel for a short period of time. Aggressive traders may decide to purchase the stock at the lower trendline and exit the trade at the higher trendline.
- Bearish traders will want to watch for a break down from the lower descending trendline of the flag formation, on high volume, for an entry. When a stock breaks down from a bear flag pattern, the measured move lower is equal to the length of the pole and should be added to the highest price within the flag.
A bear flag is negated when a stock closes a trading day above the upper trendline of the flag pattern or if the flag rises more than 50% up the length of the pole.
Want direct analysis? Find me in the BZ Pro lounge! Click here for a free trial.
The Sunrun Chart: If the bear flag pattern on Sunrun’s chart is recognized by the algorithms, traders and investors can watch for the stock to break down from the formation on higher-than-average volume. If that happens, the measured move indicates Sunrun could eventually fall toward the $12 level.
- On Wednesday, Sunrun attempted to rise up and regain support at the eight-day exponential moving average (EMA) but failed and wicked from the level. If the stock is able to regain the eight-day EMA before breaking down from the bear flag, it’s likely that the pattern has been negated. Bullish traders and investors could then watch for an uptrend to begin.
- A bounce up higher, at least within the flag formation, is likely to take place before Sunrun potentially breaks down from the flag because the relative strength index (RSI) is measuring in at about 30%. When a stock’s RSI falls to that level it becomes oversold, which can be a buy signal for technical traders.
- Sunrun has resistance above at $22.62 and $27.83 and support below at $17.70 and $15.36.