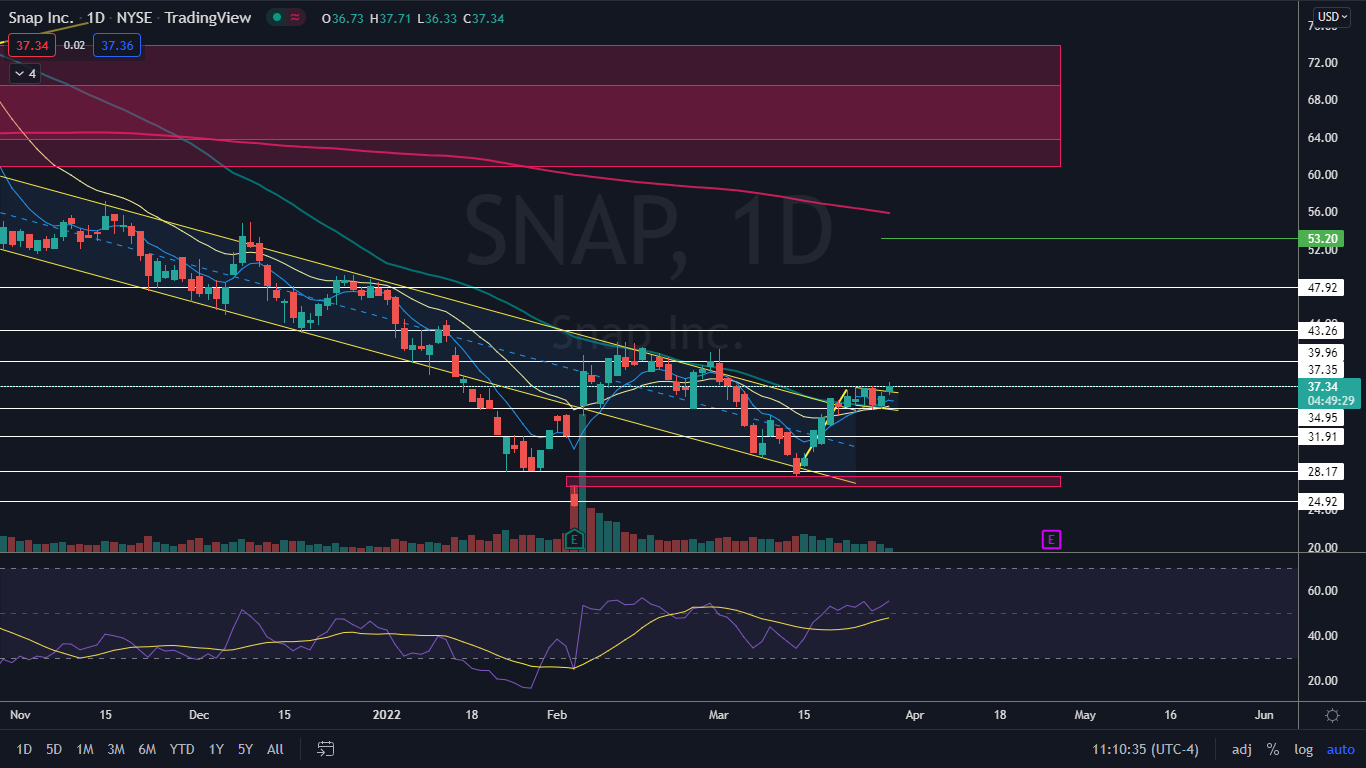
Snap, Inc (NYSE:SNAP) was trading up over 3% on Tuesday according to Benzinga Pro, attempting to break up from a bull flag pattern the stock has settled into on the daily chart.
The bull flag pattern is created with a sharp rise higher forming the pole, which is then followed by a consolidation pattern that brings the stock lower between a channel with parallel lines.
- For bearish traders, the "trend is your friend" (until it's not) and the stock may continue downwards within the following channel for a short period of time. Aggressive traders may decide to short the stock at the upper trendline and exit the trade at the lower trendline.
- Bullish traders will want to watch for a break up from the upper descending trendline of the flag formation, on high volume, for an entry. When a stock breaks up from a bull flag pattern, the measured move higher is equal to the length of the pole and should be added to the lowest price within the flag.
A bull flag is negated when a stock closes a trading day below the lower trendline of the flag pattern or if the flag falls more than 50% down the length of the pole.
See Also: How to Read Candlestick Charts for Beginners
The Snap Chart: Snap reversed north on March 15 after printing a double bottom pattern near the $28.17 level on that day and the trading day prior. The reversal to the upside, paired with the sideways consolidation that took place between March 23 and Monday, has created a bull flag pattern and on Tuesday the stock was attempting to break up from the pattern but was being held down by low volume.
- The measured move, if bullish momentum comes in later on Tuesday or on Wednesday, is about 30%, which indicates Snap could trade up toward the $45 level in the future.
- Snap is also trading in a confirmed uptrend, with the most recent higher low created on Friday at the $34.75 mark and the most recent higher high formed on Tuesday. When the stock falls down to print its next higher low above the $35 level, it may provide bullish traders who aren’t already in a position with a solid entry point.
- Snap has one gap below and one gap above on its chart, with the lower gap between $26.49 and $27.67 and the upper gap between the $60.78 and $73.89 range. Gaps on charts fill about 90% of the time, which makes it likely Snap will fill both ranges in the future.
- Snap is trading above the eight-day and 21-day exponential moving averages (EMAs), with the eight-day EMA trending above the 21-day, both of which are bullish indicators.
- Snap has resistance above at $37.35 and $39.96 and support below at $34.95 and $31.91.
Want direct analysis? Find me in the BZ Pro lounge! Click here for a free trial.


