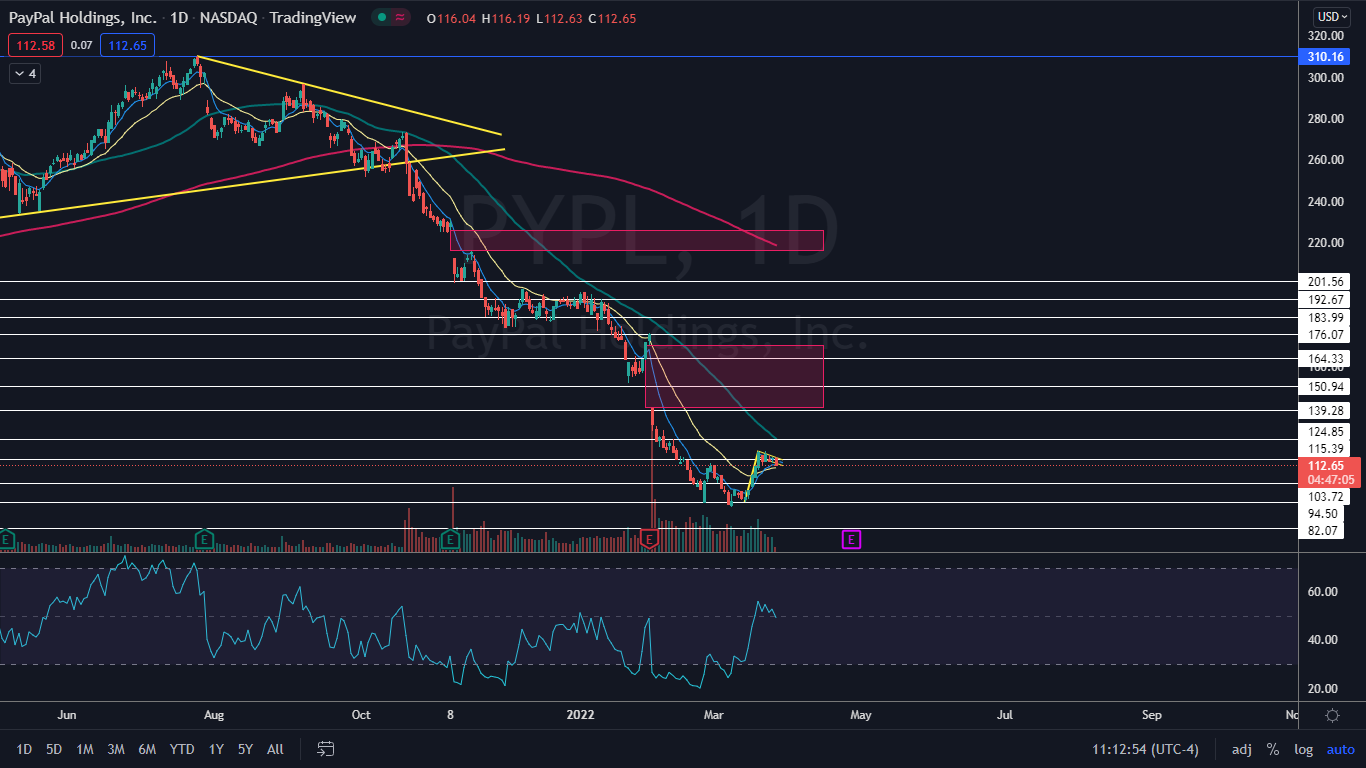
PayPal Holdings, Inc (NASDAQ:PYPL) was trading down about 3% on Friday as the stock continued to trade sideways after shooting up about 26% between March 14 and March 18.
The rise paired with the sideways consolidation has settled PayPal into a bullish flag pattern on the daily chart. The bull flag pattern is created with a sharp rise higher forming the pole, which is then followed by a consolidation pattern that brings the stock lower between a channel with parallel lines.
- For bearish traders, the "trend is your friend" (until it's not) and the stock may continue downwards within the following channel for a short period of time. Aggressive traders may decide to short the stock at the upper trendline and exit the trade at the lower trendline.
- Bullish traders will want to watch for a break up from the upper descending trendline of the flag formation, on high volume, for an entry. When a stock breaks up from a bull flag pattern, the measured move higher is equal to the length of the pole and should be added to the lowest price within the flag.
A bull flag is negated when a stock closes a trading day below the lower trendline of the flag pattern or if the flag falls more than 50% down the length of the pole.
See Also: Robinhood Fires Up Rivalry With PayPal and Other Fintech With Latest Launch
The PayPal Chart: PayPal reversed to the upside on March 15 after printing a triple bottom pattern at the $94.50 level on March 7, March 8 and March 14. The stock then soared up before beginning to trade sideways, which created a bull flag pattern on the daily chart.
- If the pattern is recognized and PayPal breaks up from the flag formation on higher-than-average volume, the measured move could take the stock up toward the $144 mark. Bullish traders may choose to take a position on the upwards break of the flag.
- Bearish traders can watch for PayPal to break down below the eight-day exponential moving average on higher-than-average bearish volume.
- PayPal has two gaps above on its chart that are about 90% likely to fill in the future. The first gap is between $139.90 and $170.53 and the second gap falls between the $215.97 and $226.25 range.
- On Friday, PayPal was trading on lower-than-average volume, which indicates there are not many buyers or sellers. By late afternoon, only about 2.94 million shares had exchanged hands compared to the 10-day average of 19.74 million.
- PayPal has resistance above at $115.39 and $124.85 and support below at $103.72 and $94.50.
Want direct analysis? Find me in the BZ Pro lounge! Click here for a free trial.


