Palantir Technologies, Inc (NYSE:PLTR) was trading down over 11% Thursday after suffering a bearish reaction to mixed fourth-quarter financial results.
Palantir reported quarterly EPS of 2 cents per share, which missed the consensus estimate of 4 cents per share. The company reported quarterly sales of $432.87 million, however, which beat the analyst consensus estimate of $417.69 million by 4%.
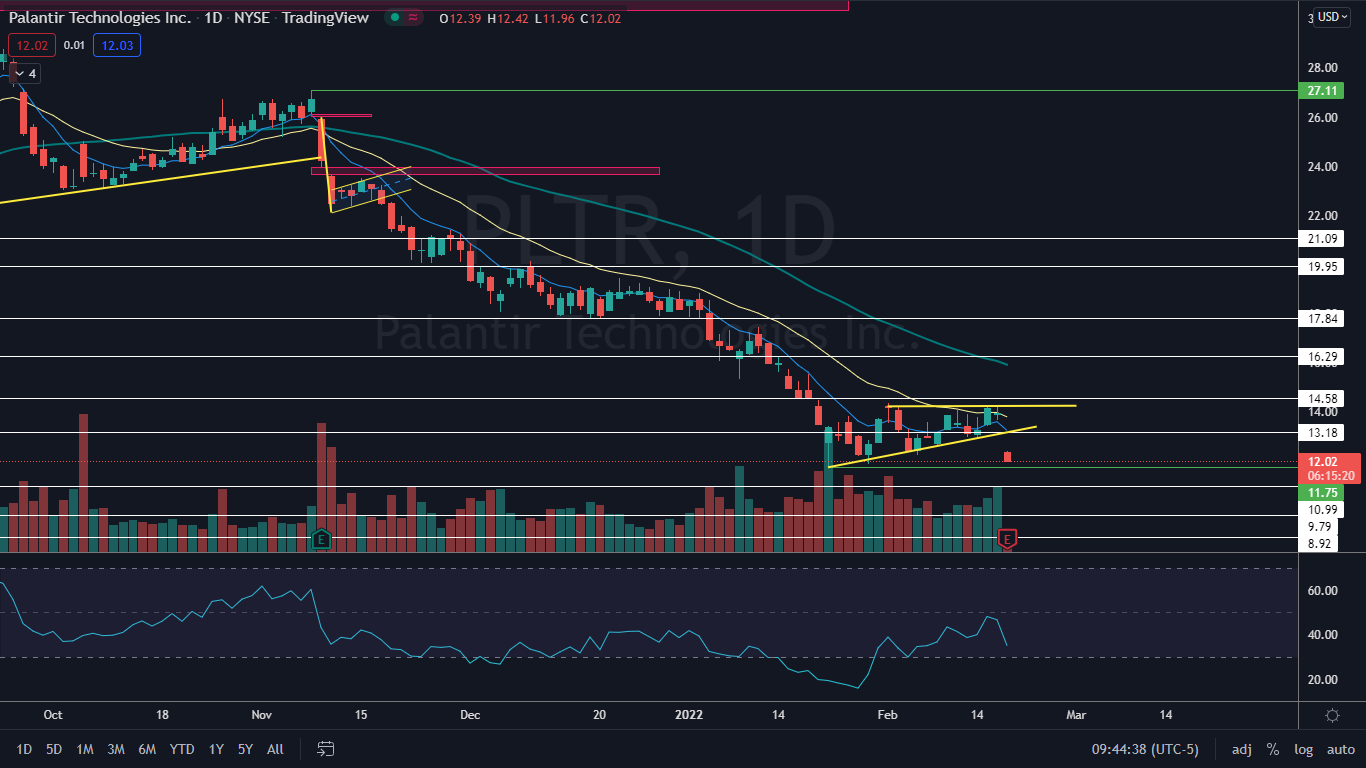
Palantir’s has been all but demolished over the past year, losing 72% of its value between Jan. 27, 2021, when the stock hit an all-time high of $45, and Jan. 24 of this year when Palantir reached a 52-week low of $11.75. The decline accelerated Nov. 9, when Palantir had a bearish reaction to its third-quarter earnings print and entered into a steep downtrend.
On Jan. 24, it looked as though the tides may have been starting to turn for Palantir because the stock began to make a series of higher lows. Thursday’s plummet has dropped Palantir back toward a key level, however, and if the area doesn’t hold, Palantir could be headed toward all-time lows.
See Also: How to Buy Palantir Technologies Stock Right Now
The Palantir Chart: Palantir had been trading in an ascending triangle on the daily chart, making higher lows but rejecting the $14.23 level on each upswing. On Thursday, Palantir broke down from the pattern on higher-than-average volume, which indicates the bears have taken control.
Palantir has a key support level at $11.75 and bulls will want to see the stock hold above that level. If Palantir tests the area as support and bounces up from the level, it will create a bullish double bottom pattern. If the stock falls through that level, however, Palantir could easily retest the all-time low of $8.92 because there is not a lot of price history below the 52-week low.
On Thursday morning, Palantir’s relative strength index (RSI) was measuring at about 34%. When a stock’s RSI nears or reaches the 30% level it becomes oversold, which can be a buy signal for technical traders. It should be noted the RSI can remain extended for long periods of time and the oscillator can pop back up above the 30% level with a bounce or sideways trading action.
Palantir is trading below the eight-day and 21-day exponential moving averages (EMAs), with the eight-day EMA trending below the 21-day, both of which are bearish indicators. The stock is also trading below the 50-day simple moving average, which indicates longer-term sentiment is bearish.
Want direct analysis? Find me in the BZ Pro lounge! Click here for a free trial.
- Bulls want Palantir to hold above the key level and trade sideways for a period of time and then for big bullish volume to come in as a reaction to a potential double bottom pattern. The stock has resistance above at $13.18 and $14.58.
- Bears want to see big bearish volume drop Palantir through the $11.75 mark and for continued momentum to push the stock toward all-time lows. Below the key level, there is support $10.99 and psychological support at $10.