NVIDIA Corp. (NASDAQ:NVDA) shares were trading lower Tuesday amid a pullback in the broader technology sector. Companies in this sector are dipping after the 10-year U.S. Treasury yield reached a two-year high, which has pressured valuations.
Nvidia was down 3.63% at $259.63 Tuesday afternoon.
See Also: Why NVIDIA, AMD And Micron Shares Are Falling Today
Nvidia Daily Chart Analysis
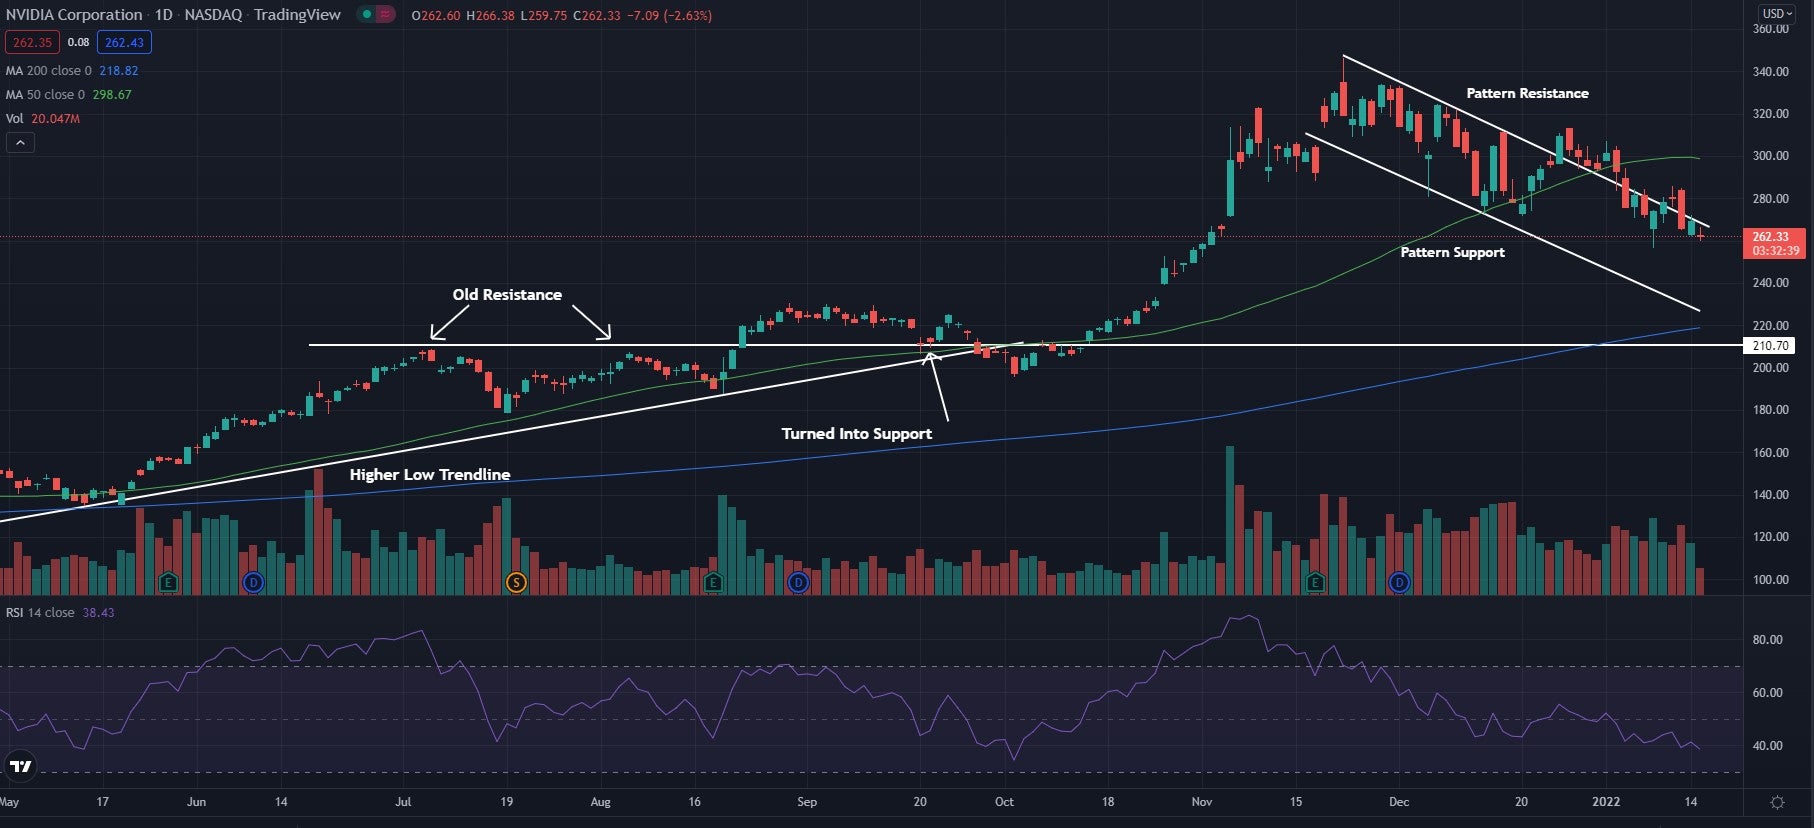
- The stock is hanging near resistance in what traders call a bullish flag pattern. If the price can cross above resistance and hold, it could be ready to see a strong bullish push once again. If unable to cross above the resistance level, the stock could continue downtrending for some time.
- The stock trades below the 50-day moving average (green) but trades above the 200-day moving average (blue), indicating the stock is in a period of consolidation. The 50-day moving average may act as a place of resistance, while the 200-day moving averages may hold as support.
- The Relative Strength Index (RSI) has been falling slightly lower the past couple of weeks and sits at 39. This shows that sellers have been moving into the stock and keeping it from breaking out. If the RSI continues to dip it could enter into the oversold area below 30 on the indicator and see much more selling pressure than buying pressure.

What’s Next For Nvidia?
As the stock holds just below resistance, it sits in a critical time where a breakout is about to occur or a rejection at the resistance level and a drop lower is coming soon. The coming weeks should confirm whether the breakout is occurring or a dip lower. Bulls are looking to see the stock cross above the resistance and be able to have a period of consolidation for a possible continuation of the bullish trend. Bearish traders are looking to see the stock to hold below the resistance and fall below the previous resistance level near $210. This could hint that the beginning of a bearish trend is occurring.


