NVIDIA Corporation (NASDAQ:NVDA) was trading near flat Thursday, in another period of consolidation where the stock shot up over 33% between March 15 and Tuesday.
The most recent rise, which took place between March 24 and March 29, combined with the downwards consolidation on Wednesday and Thursday, has settled Nvidia into a possible bull flag pattern on the daily chart.
The bull flag pattern is created with a sharp rise higher forming the pole, which is then followed by a consolidation pattern that brings the stock lower between a channel with parallel lines.
- For bearish traders, the "trend is your friend" (until it's not) and the stock may continue downwards within the following channel for a short period of time. Aggressive traders may decide to short the stock at the upper trendline and exit the trade at the lower trendline.
- Bullish traders will want to watch for a break up from the upper descending trendline of the flag formation, on high volume, for an entry. When a stock breaks up from a bull flag pattern, the measured move higher is equal to the length of the pole and should be added to the lowest price within the flag.
A bull flag is negated when a stock closes a trading day below the lower trendline of the flag pattern or if the flag falls more than 50% down the length of the pole.
See Also: Is Nvidia A Software Play? What This Analyst Sees As 'Software-Only Monetization Opportunities'
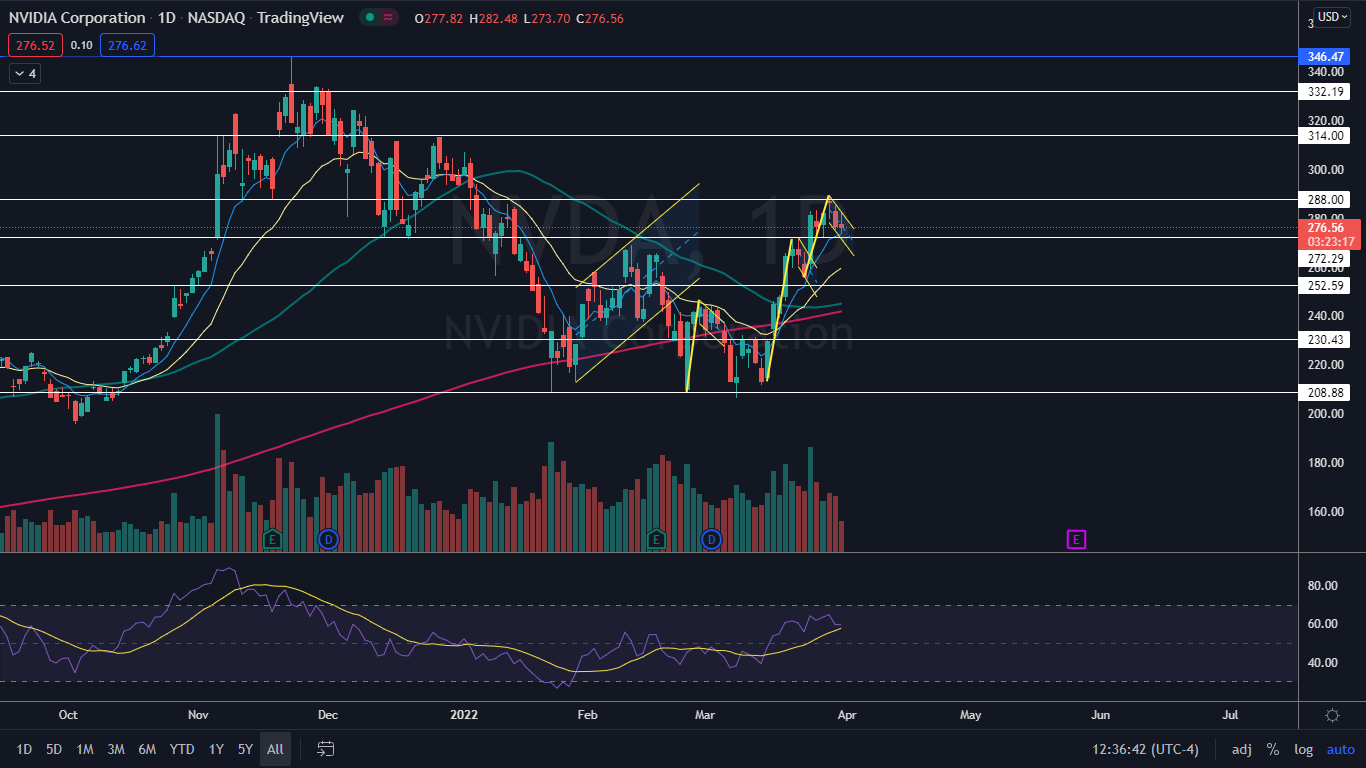
The Nvidia Chart: Nvidia broke up from a first bull flag on March 24, which had been formed between March 15 and March 23. The break up from the first flag and the subsequent three-day run to $289.46, paired with the consolidation on Wednesday and Thursday, has formed Nvidia into a second possible bull flag pattern.
- If the stock breaks up from the pattern the measured move is about 11%, which indicates Nvidia could trade up toward the $304 level. Traders and investors can watch for a breach of the upper descending trendline in the flag on higher-than-average volume to gauge whether the pattern was recognized.
- The move slightly lower on Thursday was on lower-than-average volume, which indicates consolidation as opposed to fear. As of the early afternoon, only about 25 million Nvidia shares have exchanged hands compared to the 10-day average of 56.76 million.
- If Nvidia closes the trading day near its opening price, the stock will print a doji candlestick on the daily chart, which could indicate the higher low of the uptrend is in and the stock will trade higher on Friday to possibly break up from the bull flag.
- Nvidia has resistance above at $288 and $314 and support below at $272.29 and $252.59.
Want direct analysis? Find me in the BZ Pro lounge! Click here for a free trial.