NVIDIA Corporation (NASDAQ:NVDA) continued its nine-day descent on Monday, gapping down 3.9% to start the session and closing the trading day an additional 1.34% lower.
The stock has plunged over 24% since reaching a high of $289.46 on March 29 amid overall market turbulence, which was accelerated on Monday when Baird downgraded Nvidia from Outperform to Neutral and lowered its price target from $360 to $225.
In the premarket on Tuesday, Nvidia was rebounding slightly, in tandem with the over market, despite KeyBanc announcing it has maintained an Overweight rating on the stock, while lowering its price target to $310.
The Consumer Price Index (CPI) report, which measures inflation, came in just slightly higher than expected, despite the White House on Monday warning it expected to see a surge in consumer prices due to Russia’s invasion of Ukraine. U.S. consumer prices for March came in at 1.2% month-to-month, compared to the consensus estimate of 1.1%.
Whether the bounce in Nvidia can eventually turn into a rally, or whether the stock will rebound only enough to print a lower high before continuing its descent, will take some time to be known, but the stock has an abundance of work to do before reversing course into an uptrend.
Want direct analysis? Find me in the BZ Pro lounge! Click here for a free trial.
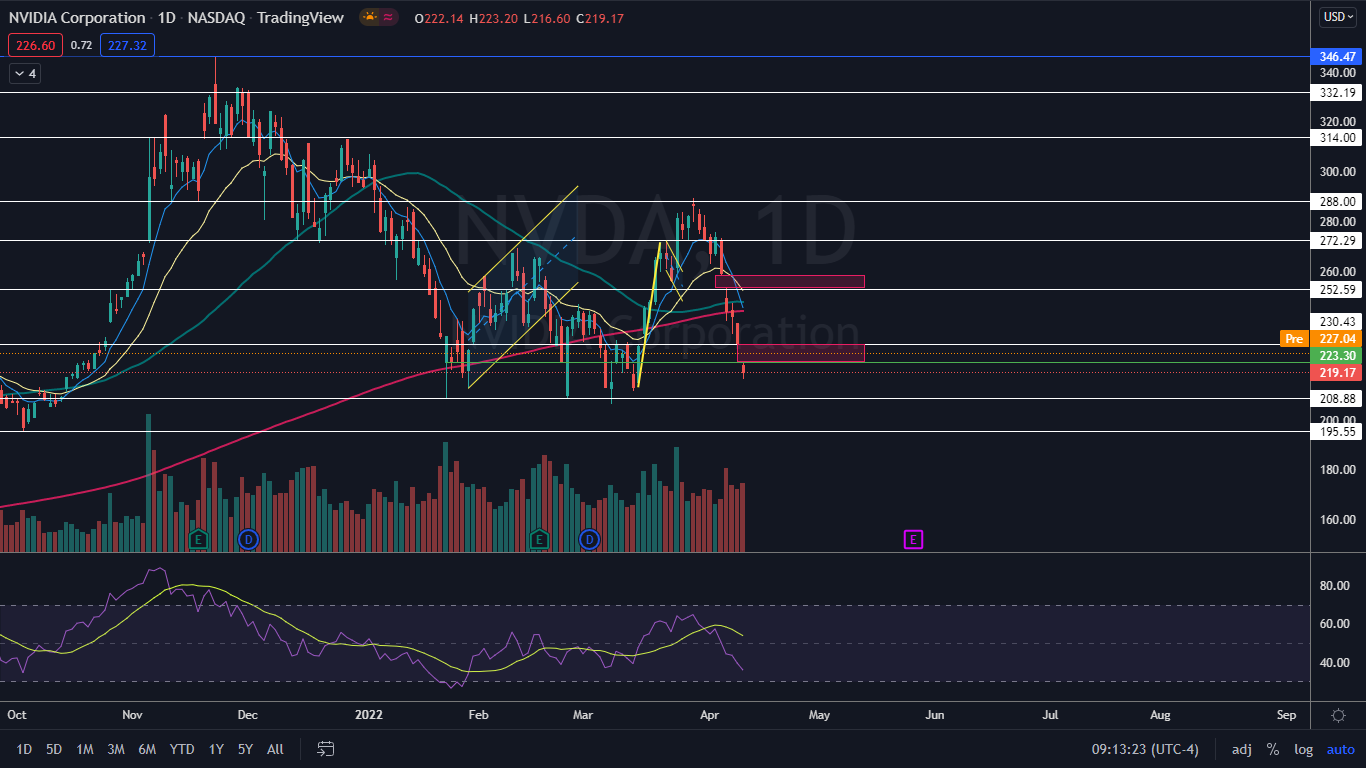
The Nvidia Chart: Nvidia began trading in a downtrend on March 29, with the most recent lower high printed on April 4 at $275.58 and the most recent confirmed lower low created at the $262.67 mark on April 1. Since forming the last lower high, Nvidia has fallen over 20% lower without bouncing on the daily chart.
- To continue in its downtrend, the stock will eventually have to bounce up to print another lower high, which could give bearish traders who aren’t already in a position a solid entry to take a short position. Bullish traders who are not already in a position will want to watch to see if Nvidia can begin to print an uptrend on lower timeframes, which could then develop into an uptrend on the daily chart.
- On April 7, Nvidia lost support at the 200-day simple moving average (SMA), which is considered a bellwether for bearish versus bullish long-term sentiment. If the stock is unable to regain the 200-day SMA in short order, the 50-day SMA is set to cross below the 200-day, which would cause a death cross to develop on the chart.
- Nvidia has two gaps above, with the first between $223.20 and $230.62 and the second between the $253 and $258.20 range. Gaps on charts fill about 90% of the time, which makes it likely the stock will rise up to fill both empty trading ranges in the future.
Nvidia has resistance above at $230.43 and $252.59 and support below at $208.88 and $195.55

See Also: How to Read Candlestick Charts for Beginners
Photo: Courtesy of nvidianews.nvidia.com


