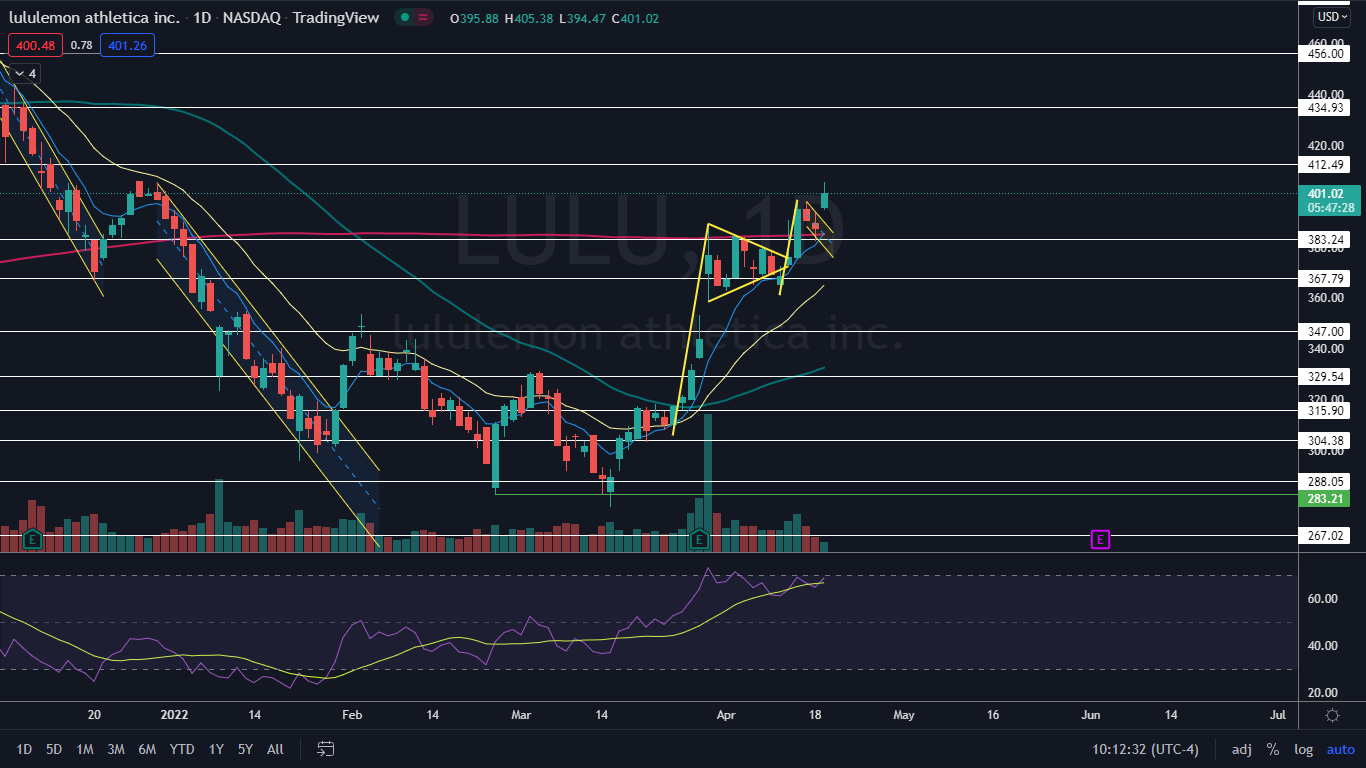
Lululemon Athletica, Inc (NASDAQ:LULU) gapped up over 2% higher to start the trading day on Tuesday and ran an additional 2.4% higher at one point intraday.
The stock broke up from a bull flag on April 13, which Benzinga called out on April 7 before forming another bull flag and breaking up from it on Tuesday.
The bull flag pattern is created with a sharp rise higher forming the pole, which is then followed by a consolidation pattern that brings the stock lower between a channel with parallel lines or into a tightening triangle pattern.
- For bearish traders, the "trend is your friend" (until it's not) and the stock may continue downwards within the following channel for a short period of time. Aggressive traders may decide to short the stock at the upper trendline and exit the trade at the lower trendline.
- Bullish traders will want to watch for a break up from the upper descending trendline of the flag formation, on high volume, for an entry. When a stock breaks up from a bull flag pattern, the measured move higher is equal to the length of the pole and should be added to the lowest price within the flag.
A bull flag is negated when a stock closes a trading day below the lower trendline of the flag pattern or if the flag falls more than 50% down the length of the pole.
See Also: Lululemon Signs First Golfer And You Won't Believe Who It Is
The Lululemon Chart: Lululemon’s most recent bull flag was created between April 11 and Monday, with the pole formed over the first three trading days of that period and the flag over the course of Friday and Monday. The measured move on the break of the pattern is about 10%, which indicates Lululemon could trade up toward the $430 level in the future but because this bull flag is a continuation of the previous bull flag, a return to all-time highs is still in play.
- On the first day of creating the most recent bull flag pattern, Lululemon created a bear trap on the daily chart, by breaking down below the previous bull flag pattern that was created between March 24 and April 8. Technical traders may have known the bear trap had taken place because Lululemon broke down from the pattern on lower-than-average volume, which is an indication that either a pattern isn’t recognized or a trap has been set.
- When Lululemon broke up from the bull flag on Tuesday, it was on higher-than-average volume on the 15-minute timeframe, which indicates the pattern is recognized by the algorithms. Traders and investors will be watching for continuation on the break out later on Tuesday, after the stock goes through a period of consolidation on smaller timeframes.
- Lululemon has resistance above at $412.29 and $434.93 and support below at $383.24 and $367.79.
Want direct analysis? Find me in the BZ Pro lounge! Click here for a free trial.


