Ford Motor Co (NYSE:F) gapped down 0.85% on Thursday to start the trading day and slid an additional 2.12% off the open before running into a group of buyers who pushed the stock up to work toward printing a dragonfly doji candlestick on the daily chart.
The stock appeared to be ignoring news that Ford issued a recall of almost 200,000 2015-2017 Ford Expeditions and Lincoln Navigators over a fire risk.
A dragonfly doji candlestick forms when a red or green candlestick prints with a long lower wick and a small to almost non-exist body, which indicates the opening and closing price are close to flat.
A dragonfly doji candlestick, when found in a downtrend, can indicate a reversal to the upside is on the horizon. It is a lagging indicator, since the next candle on the time frame being studied must print before the pattern can be validated.
A dragonfly doji candlestick doesn’t necessarily mean a new uptrend will occur, only that a bounce higher is likely imminent.
Candlestick patterns can be used to indicate the future price direction of a stock. Candlestick patterns are especially useful for technical traders when they are combined with other indicators such as larger patterns, trading volume, relative strength index (RSI) and divergences between RSI and price action.
Want direct analysis? Find me in the BZ Pro lounge! Click here for a free trial.
The Ford Chart: Ford began trading in a downtrend on Aug. 16, when the stock attempted to regain the 200-day simple moving average (SMA) on the daily chart but failed.
The most recent lower high within the trend was formed on Aug. 26 at $16.09 and the most recent confirmed lower low was printed at the $14.91 mark on Aug. 12.
- Thursday’s candlestick may suggest a bounce will occur on Friday, but the most likely scenario is that the stock will top out below the $16 mark. If the stock is able to charge above that level, however, or bounce up and retrace only to make a higher low above $14.78, the downtrend will be negated.
- Bulls want to see Ford regain the eight-day exponential moving average (EMA) as support, which will avoid the eight-day EMA crossing below the 21-day, which would be bearish. If Ford continues to trend lower, the 50-day SMA will be an important area to hold above.
- Ford has resistance above at $15.51 and $16.45 and support below at $14.34 and $12.79.
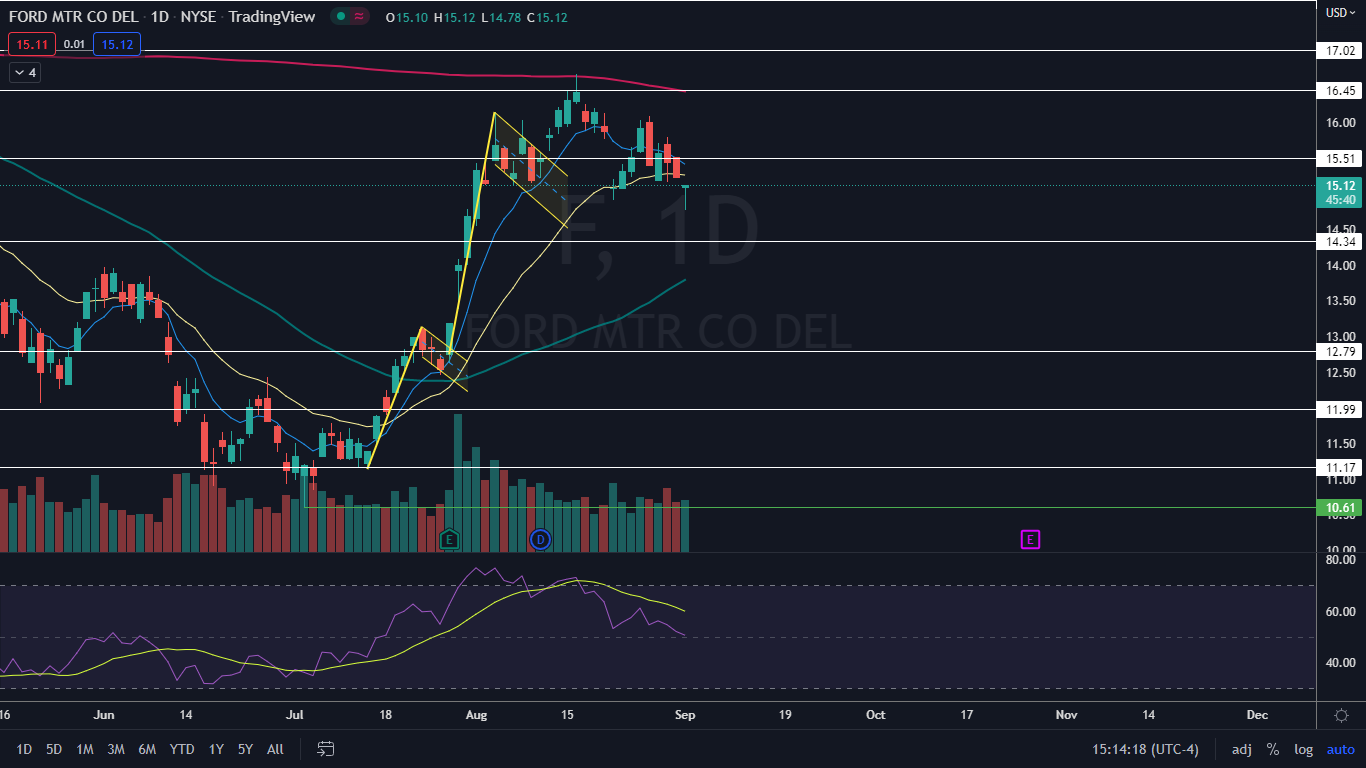
Photo via Shutterstock.