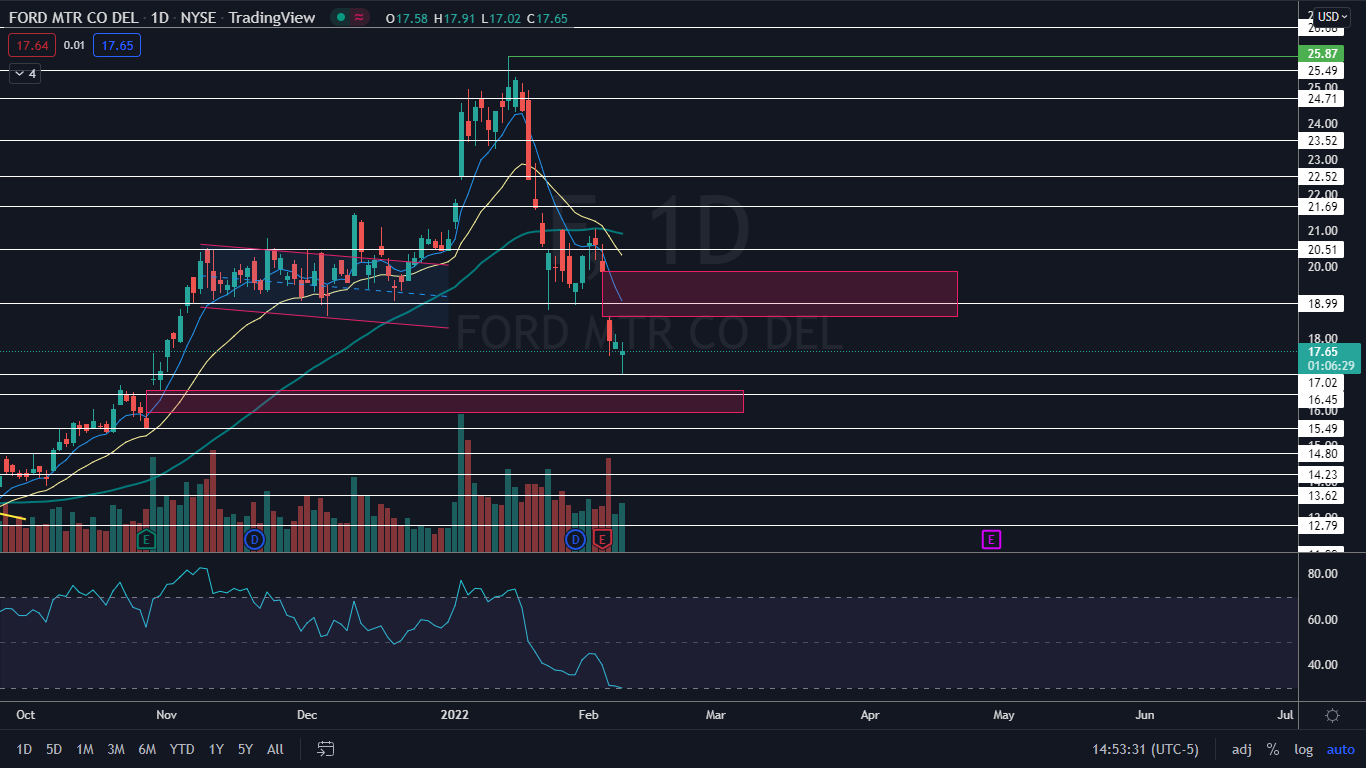
Ford Motor Co (NYSE:F) was trading slightly lower on Tuesday afternoon after bouncing up off a support zone near the $17 level that the stock has not traded below since Nov. 1.
When the legacy-turned-EV manufacturer printed a fourth-quarter earnings miss on Feb. 3, the stock gapped down 7.83% lower the following trading day and fell another 3.05% intraday to close that session at the $17.96 level. On Tuesday, Ford stock was printing a candlestick pattern that could indicate the downtrend is coming to an end.
See Also: How to Buy Ford Stock
The Ford Chart: On Tuesday afternoon, Ford looked to be printing either a doji candlestick or a hammer candlestick on the daily chart. Both candlesticks, when found in a downtrend, can indicate higher prices may come the following day.
- Ford has two gaps on its chart, which the stock is likely to trade into in the future because gaps on charts fill about 90% of the time. The first gap is between $15.92 and $16.55 and the second higher gap falls between the $18.59 and $19.87 range.
- The stock’s relative strength index (RSI) hit the 29% level on Tuesday, which makes it likely at least a bounce is in the cards. When a stock’s RSI reaches or falls below the 30% level, it becomes oversold, which can be a buy signal for technical traders.
- Ford’s daily volume is at near average, which paired with the doji or hammerstick candle indicates there is an equal amount of interest from both the bulls and the bears.
- If the stock opens the trading day on Wednesday within Tuesday’s range and develops an inside bar, the bulls and bears can watch for a break up or down from the pattern to gauge future direction.
- Ford has resistance above at $18.99 and $20.51 and support below at $17.02 and $16.45.
Want direct analysis? Find me in the BZ Pro lounge! Click here for a free trial.


