Ford Motor Co (NYSE:F) opened flat on Monday, rose up slightly and then ran into a group of sellers who knocked the stock down almost 3% by early afternoon.
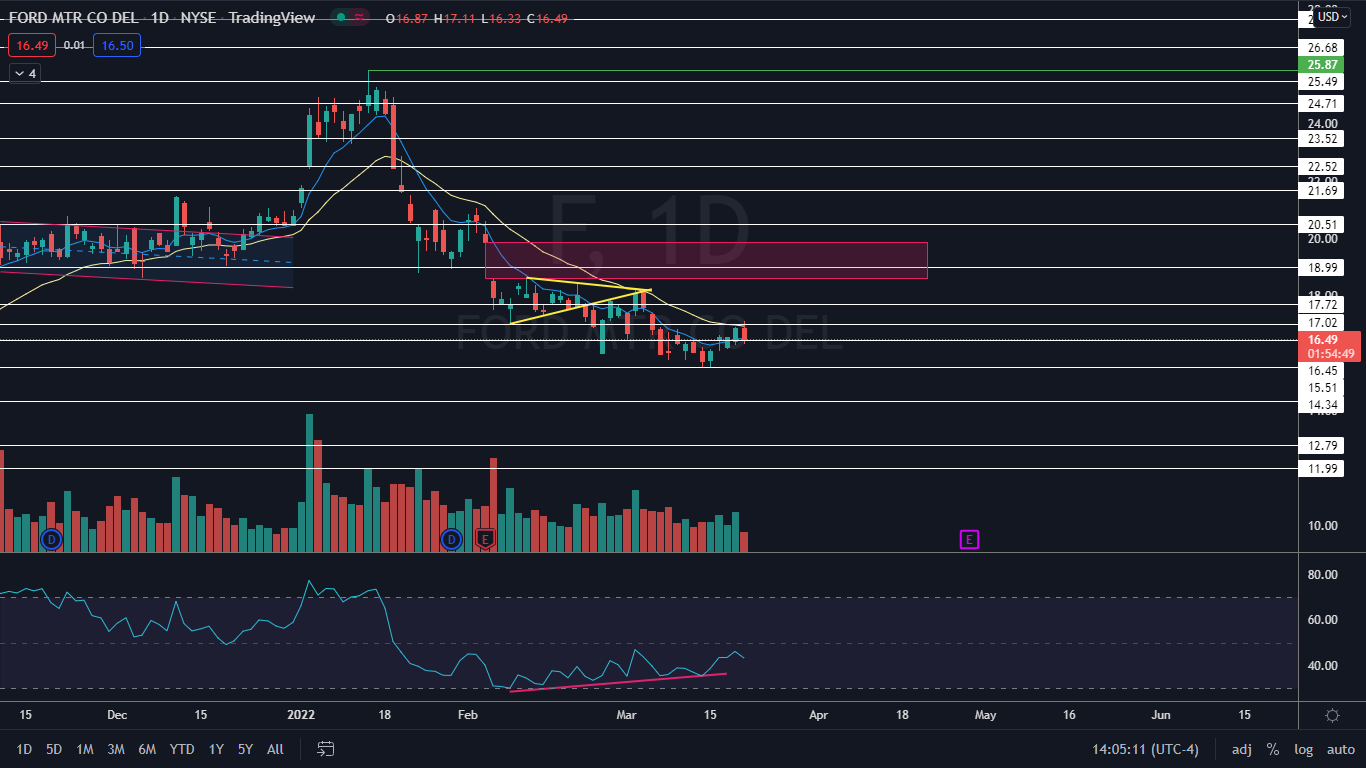
The stock has been trading in a steep downtrend since Jan. 13, declining over 40% from the high of $25.87 to reach a low of $15.51 on March 14. On March 15, Ford retested the low as support and bounced, which created a bullish double bottom pattern at that level. On March 16, the pattern was recognized and Ford shot up 6.51% between the March 15 closing price and the high-of-day on Monday.
Ford was partly propelled higher on March 17, when the Environmental Protection Agency (EPA) range for the automaker’s highly anticipated F-150 Lightning electric pickup truck was leaked, which came in at 230 miles for the entry level model and 300 miles for the model with an extended range battery.
The EPA range came in slightly below Rivian Automotive, Inc.'s (NASDAQ:RIVN) R1T EV pickup truck, but Ford’s F-150 Lightening costs substantially less, with a starting price of $41,669 compared to the R1T EV, which starts at $79,500.
Although Ford was pulling back on Monday, the retracement is necessary if the stock is going to confirm an uptrend, and if Ford can signal an eventual reversal above the double bottom level it could give bullish traders who are not already in a position a solid entry point.
See Also: Ford CEO Praises Use Of Transit Van In Ukraine Rescue Efforts
The Ford Chart: The retracement on Monday was being made on lower-than-average volume, which indicates healthy consolidation is taking place. If the stock closes the trading day near its low-of-day, it will print a bearish engulfing candlestick, which could indicate lower prices may come on Tuesday. If lower prices come, traders can watch for the stock to print a reversal candlestick such as a doji or hammer, which could mark the higher low.
Between Feb. 4 and March 15, Ford had developed bullish divergence on the daily chart, where the stock continues to make lower lows while the relative strength index made a consistent series of higher lows. The divergence indicated that higher prices would come, which coincided with the double bottom pattern, making the potential chance of a reversal stronger.
Ford has a gap above between $18.59 and $19.87. Gaps on charts fill about 90% of the time, so it is likely Ford will rise up to fill the trading range in the future. If Ford soars up to fill the gap, it will represent about a 20% move to the upside from the current share price.
Ford is trading in line with the eight-day exponential moving average (EMA) and slightly below the 21-day EMA, with the eight-day EMA trending below the 21-day. If Ford is able to regain the 21-day EMA as support and remain trading above the level for a period of time, the eight-day EMA will cross back above the 21-day, which would give bulls more confidence going forward.
Want direct analysis? Find me in the BZ Pro lounge! Click here for a free trial.
- Bulls want to see continued consolidation on lower-than-average volume and then for big bullish volume to come in and drive the stock up over the 21-day EMA, which will also cause the stock to regain a support level at $17.02. Above the level, there is further resistance at $18.99 and $20.51.
- Bears want to see big bearish volume come in and drop Ford down below the $15.50 level, which will indicate the move higher was a bull trap and the stock will resume its downtrend. Below the area, there is support at $14.34 and $12.79.