- The daily chart for November 2023 soybeans shows a new short-term downtrend began at Tuesday's close.
- On the other hand, the long-term continuous monthly chart continues to show a mix of bullish and bearish patterns.
- Leaving us with the contract's weekly chart that still shows an intermediate-term downtrend is in place.
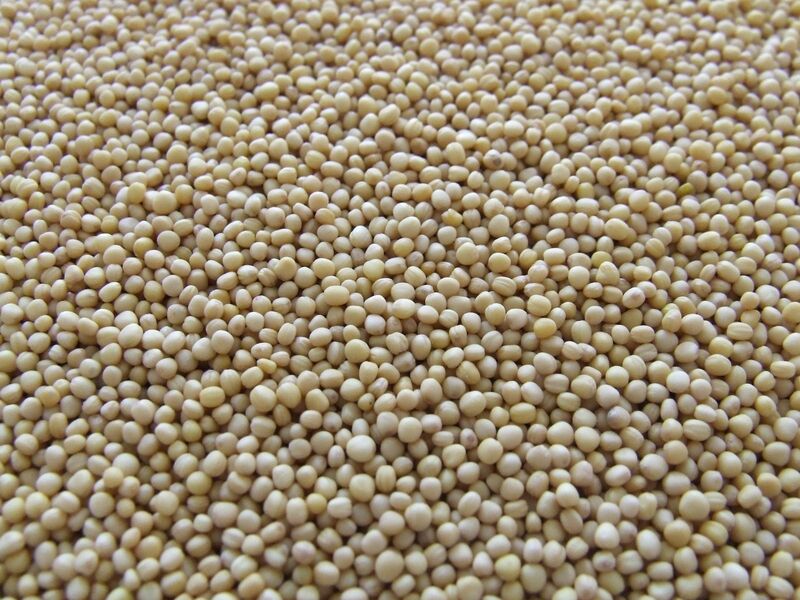
The end of August is now clearly in sight, but what does that mean for the US soybean market? First, though I don’t necessarily follow the concept of “marketing years” anymore, the industry standard tells us the 2022-2023 edition ends abruptly and the 2023-2024 version immediately begins. The squawking throng will tell you this changes everything we know about supply and demand. Why? Because it’s a new marketing year. Sure. Generally speaking, these are the same folks telling you how important NASS’ weekly crop condition and progress nonsense is every week. But I digress.

Fundamentally, I’m not expecting to see the soybean market change all that much from August 31 to September 1. As we head into Wednesday’s session we know national average basis continues to weaken with my Tuesday evening calculation coming in at 15.0 cents under November futures as compared to Monday’s 12.75 cents under and last Friday’s figure of 10.25 cents under November. On the futures spread front we saw the Nov-January close Tuesday at a carry of 12.5 cents and covering 38% calculated full commercial carry (cfcc). Applying my table, conveniently broken into thirds, this tells us commercial traders hold a neutral-to-bullish view of short-term supply and demand, likely due to the reality newly harvested bushels will soon be arriving in the US. Given US producers like to sell soybeans and hold corn, regardless of what the markets are saying, it would not be surprising to see basis and futures spreads continue to weaken over the coming weeks. Longer-term the market remains bullish with the Nov-July spread covering only 9% cfcc. We’ll see how, or if, this outlook changes. But that’s a piece for another time.
Today I want to talk about the technical side of November soybeans. Once the dust from Tuesday’s session had settled, my Chart of the Day was the daily study for the Nov23 contract. To set the stage, Nov gapped higher Sunday night before posting a high of $14.0950 during Monday’s session before closing at $14.0575, up 18.0 cents for the day. Tuesday rolled around and the contract was under pressure, so much so it fell to a low of $13.92 before closing at $13.9250. The fact Nov23 first closed near its session high on a rally, then near its session low the next day completed a bearish 2-day reversal confirming a new short-term downtrend was in place. How much confidence do I have in that conclusion? I’ll refer once again to the Goldilocks Principle that tells us “Daily charts are too hot, monthly charts are too cold, but weekly charts are just right”.
So what about the monthly chart? The continuous November only shows the 2023 issue posted a new 4-month high during July, a reversal pattern telling us the long-term trend had turned up. However, by the time we got to the end of last month Nov23 was below its June settlement of $13.4325, creating a bearish monthly range. As August has unfolded we’ve seen a solid selloff followed by a strong 3-week rally to close out the month, creating another bullish range. As strange as it to say, the monthly chart has been almost as hot as the daily chart this summer.
This leaves us with November’s weekly chart, and it’s here where we can finally start to make some sense out of the chaos. Nov23 completed a clear bearish spike reversal the week of July 24, confirming a new intermediate-term 3-wave (Elliott Wave) downtrend was in place. Wave A (the first wave) saw Nov23 fall to a low of $12.8225 the week of August 7. However, it was then the weather forecasts turned hot and dry for the rest of August and the contract, being a weather derivative at heart, rallied accordingly. After closing higher the past two weeks, Nov23 was in position for a possible third weekly close in the green within the uptrend. In other words, a classic Benjamin Franklin Fish Analogy (Like guests and fish, markets start to stink after three days/weeks/months (whatever time frame is being studied) against the trend) was forming. With not much else to watch, it will be interesting to see where the contract is priced at this Friday’s settlement in relation to last Friday’s close of $13.8775.
What then do we know about soybeans heading into September? The market is getting less bullish fundamentally, and since Newsom’s Rule #6 tells us “Fundamentals win in the end”, it would not be surprising to see funds continue to sell as well. To that end, the intermediate-term trend remains down with Nov23 expected to take out its recent low of $12.8225. After that, with the market still longer-term fundamentally bullish (for now), it will be about demand for the 2023 US crop.
On the date of publication, Darin Newsom did not have (either directly or indirectly) positions in any of the securities mentioned in this article. All information and data in this article is solely for informational purposes. For more information please view the Barchart Disclosure Policy here.