Coinbase Global, Inc (NASDAQ:COIN) popped up 7% higher on Monday.
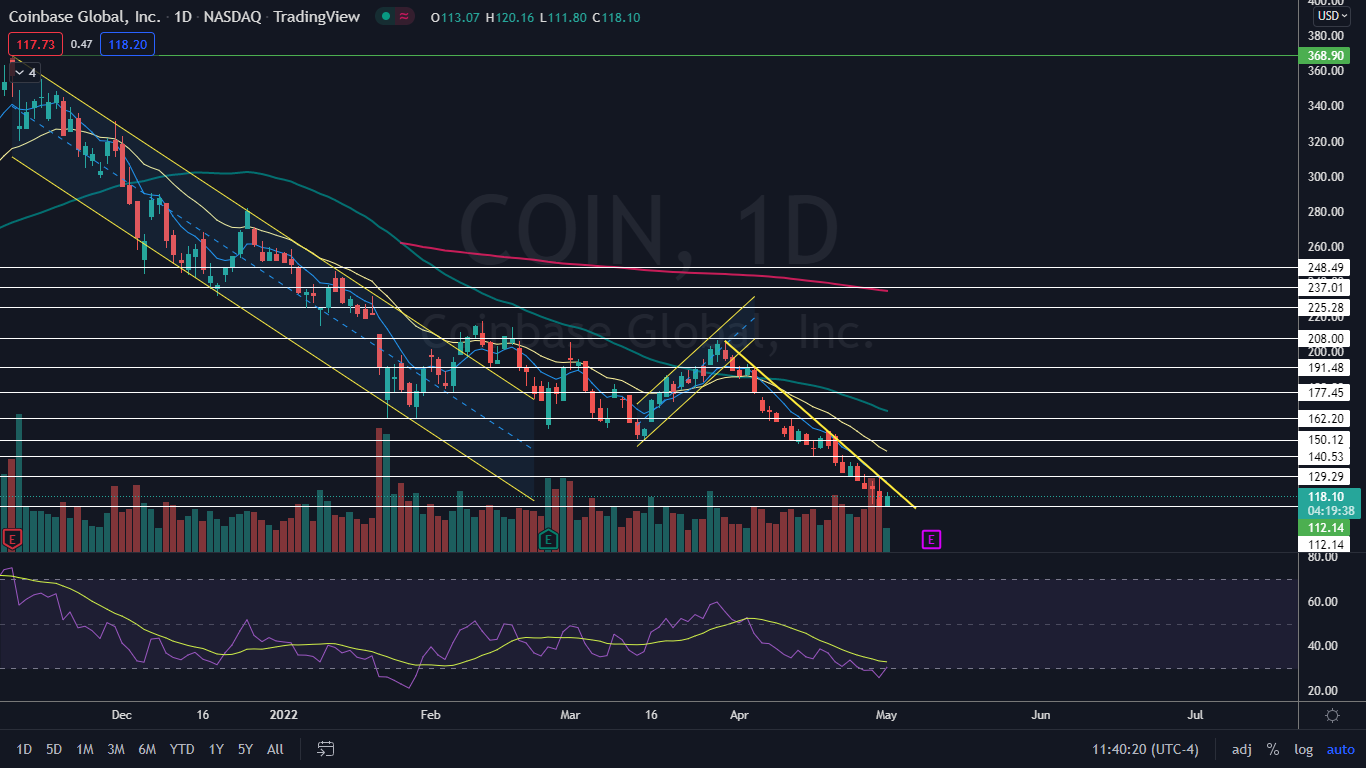
The crypto trading platform has been trading under a descending trendline in a steep downtrend since March 30, plunging over 40% since that date to Monday’s all-time low at the $111.80 level.
A descending trendline acts as a resistance level and indicates there are more sellers than buyers even though the price continues to fall.
In order for a trendline to be considered valid, the stock or crypto must touch the line on at least three occasions. After that, the more times the trendline is touched the weaker it becomes.
- Bullish traders can watch for a stock or crypto to break up from the descending trendline and, if the break happens on high volume, can indicate the downtrend is over and a rally may be on the horizon. It's possible the stock or crypto may fall down to back-test the descending trendline as support before heading higher again.
- For bearish traders “the trend is your friend” (until it’s not) and a touch and rejection of the descending trendline can offer a good short entry. A bearish trader would stop out of this type of trade if the stock or crypto broke above the trendline.
Want direct analysis? Find me in the BZ Pro lounge! Click here for a free trial.
The Coinbase Chart: On Monday, when Coinbase tested Friday’s low-of-day near the $112 mark and bounced, the stock formed a bullish double bottom pattern at the level. If bullish momentum comes in later on Monday or on Tuesday, it may give the stock enough power to break up bullishly from the descending trendline.
- Coinbase is also forming an inside bar pattern on the daily chart, with all of Monday’s price action within Friday’s range. Although the pattern leans bearish in this case, because Coinbase was trading lower before forming the inside bar, the double bottom pattern may be dominant.
- A bounce to the upside is also likely because Coinbase’s relative strength index (RSI) has been measuring at 25% and 33% since April 22. When a stock’s RSI reaches or falls below the 30% level it becomes oversold, which can be a buy signal for technical traders.
- If Coinbase closes the trading session near its high-of-day price, the stock will print a bullish Marubozu candlestick, which could indicate higher prices and a break up from the descending trendline is in the cards. If the stock breaks bearishly from the inside bar pattern due to overall market weakness, Coinbase will fall to a new all-time low.
- Coinbase has resistance above at $129.29 and $140.53 and the only support below in the form of price history is at the $112 level.