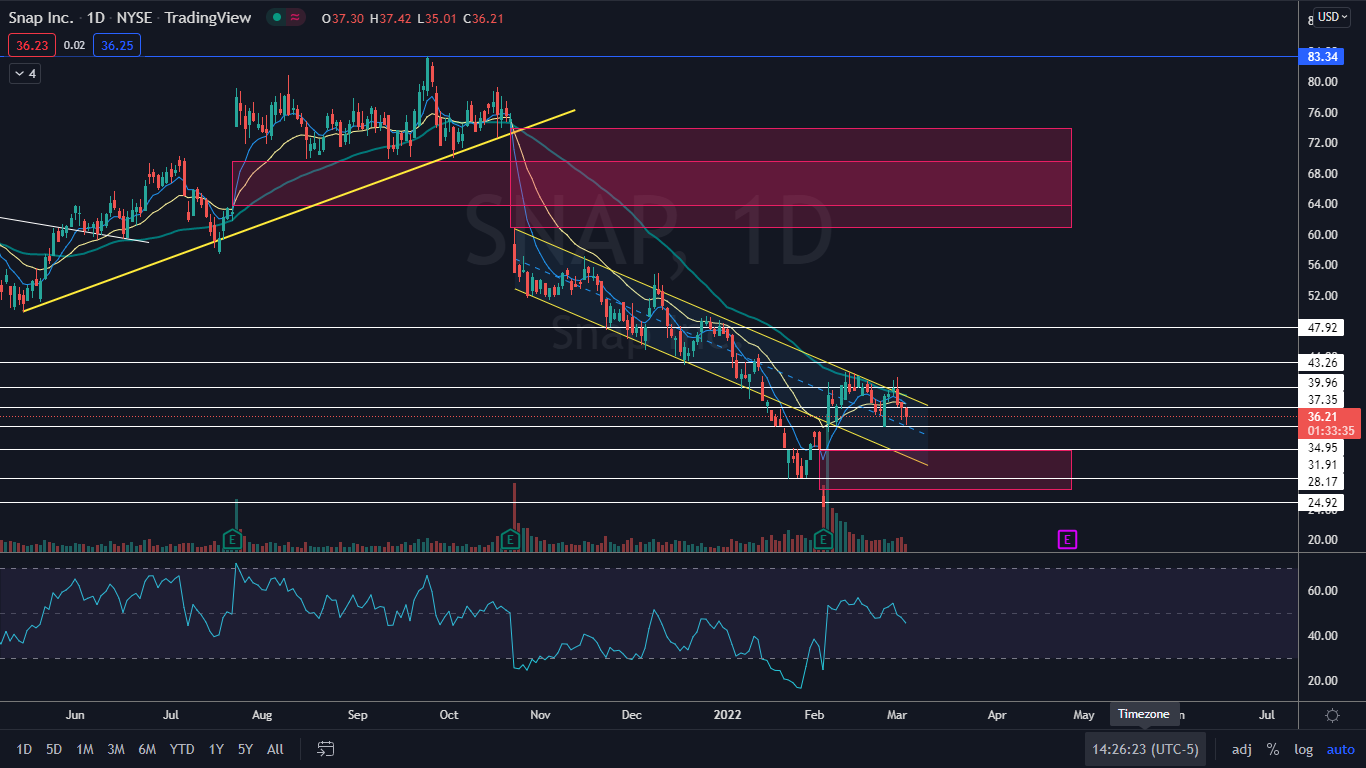
Snap, Inc (NYSE:SNAP) was trading down more than 5% on Thursday compared to the S&P 500, which was trading near flat after a morning dip caused by Federal Reserve chairman Jerome Powell’s testimony in front of the Senate banking committee, where he said the central bank will go ahead with its plans to raise interest rates this month.
Over the past three trading days, Snapchat's stock has erased all of the gains it had made between Feb. 24 and Feb. 28, when the stock bounced up aggressively from a support level at $34.95.
This week, Snap joined a wide array of other large companies to adjust its business model in Russia, Belarus and Ukraine. To stop misinformation while continuing to allow its users access to Snapchat as a communication tool, Snap decided to halt all advertising on its platform in the three eastern European countries. Snap also took steps to stop all Belarusian and Russian entities from collecting revenues from advertisements.
Snap has been beaten down since Sept. 24, 2021 when it reached an all-time high of $83.34, declining over 56% from that level. If the stock can hold above a key level at $35, however, Snap may print a bullish reversal pattern.
Want direct analysis? Find me in the BZ Pro lounge! Click here for a free trial.
The Snap Chart: After breaking bearishly from a descending channel on Jan. 1 and entering into a steeper downtrend, Snap popped back up into the pattern on Feb. 4, when the stock received a bullish reaction to its fourth-quarter earnings print. A descending channel is considered to be bearish until a stock breaks through the upper descending trendline of the pattern, which can be a strong reversal signal.
- After that 58% two-day rally on Feb. 4, Snap entered equilibrium and has been trading in a fairly tight range between about $34 and $41.
- The $35 level has become a key support level because Snap has tested the area three times, including Thursday, and bounced. This has created a possible bullish triple bottom pattern on the daily chart.
- On Thursday, Snap was also looking to print a hammer candlestick on the daily chart, which if recognized, could result in the stock seeing higher prices on Friday.
- Bullish traders would like to see big bullish volume enter the stock to push it up out of the falling channel and the equilibrium. There is resistance above at $37.35 and $39.96.
- Bearish traders would like to see big bearish volume come in and drop Snap back down below $35 and toward the lower trendline of the channel. There is support below at $34.95 and $31.91.


