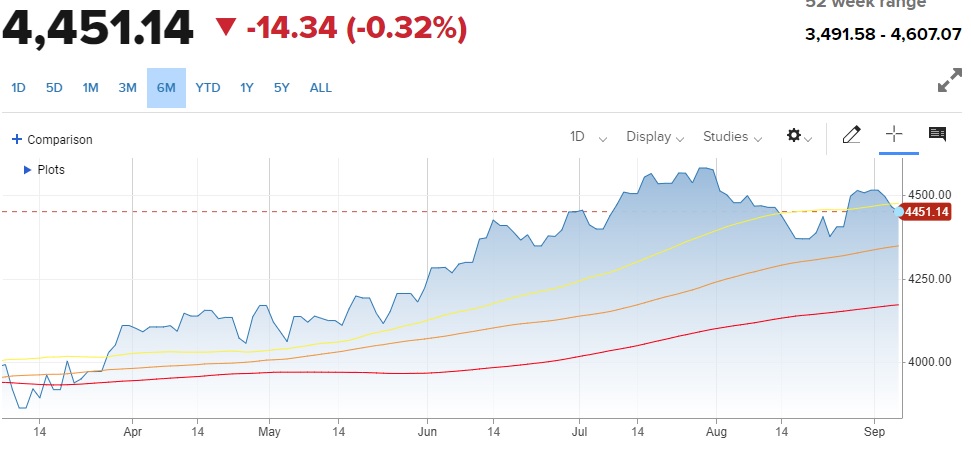
My expectation of a trading range forming is playing out right on schedule. That being where resistance was found at 4,600 for the S&P 500 (SPY) which was simply too high after an overextended bull run.
On the other hand, there was no need for stocks to sell off more than 5%. Thus, support was found just above the 100 day moving average currently at 4,344.

Moving Averages: 50 Day (yellow), 100 Day (orange), 200 Day (red)
In a trading range scenario, the market is overly susceptible to each new headline. One day that blows bearish...and the very next day gloriously bullish.
In short, almost every move inside a trading range is meaningless noise. And thus should mostly be ignored.
That is because the VAST MAJORITY of the time, the market breaks out of the range in the same direction it was going before the range formed. In the current case that means we should break higher out of this range unless there is truly a threat to the bullish thesis.
That would require that the preponderance of the evidence starts to show that the odds of a recession have greatly increased. That is currently not true.
What is true is that we find that the recent economic data is a bit better than expected. Normally that is awesome news that has stocks spiking higher.
Unfortunately, that is not so awesome when the Fed is worried about lingering high inflation not fading away quickly enough. Simply stated...
The more robust the economy looks > the stickier high inflation becomes > the more likely the Fed raises rates even higher > the more they risk creating a recession instead of soft landing
Indeed, the recently improved economic picture has also increased the odds of a Fed rate hike at the November or December meetings. Just a month ago only 28% odds were placed another 25 basis point from the Fed. As for today that is now up to 46%. This again explains the stock market weakness this week.
Let me be clear...The improved data for ISM Services and Jobless Claims this week, that sparked the most recent sell off, does increase the odds of more rate hikes. But as Goldman Sachs predicts, the odds of a new recession forming in the next 12 months is still only around 25%. That means we are much more likely to have a soft landing which keeps the long term bullish thesis in place.
At this stage investors are likely going to react strongly to other upcoming economic events coming into the 9/20 Fed Rate decision. The roll call of reports includes:
9/13 Consumer Price Index
9/14 Producer Price Index, Retail Sales & Jobless Claims
9/20 Fed Rate
Note that right now most investors are expecting the Fed to hit the pause button on rates at this September 20th meeting. The key for investors is focusing on what Powell says at his press conference. That will provide their intentions for future meetings. Again, the odds for a rate increase in November or December is getting ever closer to 50%.
Trading Plan and Next Steps
Nobody knows when this trading range will end. But likely it will be before the holidays when the seasonal good tidings help to create a Santa Claus rally.
Thus, it is important look past the day to day fluctuations to appreciate that the long term picture is still bullish. This makes it wise to use meaningful dips in the range to buy the best looking stocks.
Which stocks are those?
More on that in the next section...
What To Do Next?
Discover my current portfolio of 7 stocks packed to the brim with the outperforming benefits found in our POWR Ratings model.
Plus, I have added 4 ETFs that are all in sectors well positioned to outpace the market in the weeks and months ahead.
This is all based on my 43 years of investing experience seeing bull markets...bear markets...and everything between.
If you are curious to learn more, and want to see these 11 hand selected trades, then please click the link below to get started now.
Steve Reitmeister’s Trading Plan & Top Picks >
Wishing you a world of investment success!

SPY shares were trading at $444.98 per share on Friday afternoon, up $0.13 (+0.03%). Year-to-date, SPY has gained 17.23%, versus a % rise in the benchmark S&P 500 index during the same period.
About the Author: Steve Reitmeister

Steve is better known to the StockNews audience as “Reity”. Not only is he the CEO of the firm, but he also shares his 40 years of investment experience in the Reitmeister Total Return portfolio. Learn more about Reity’s background, along with links to his most recent articles and stock picks.
Why Are Stocks Weak Again? StockNews.com


