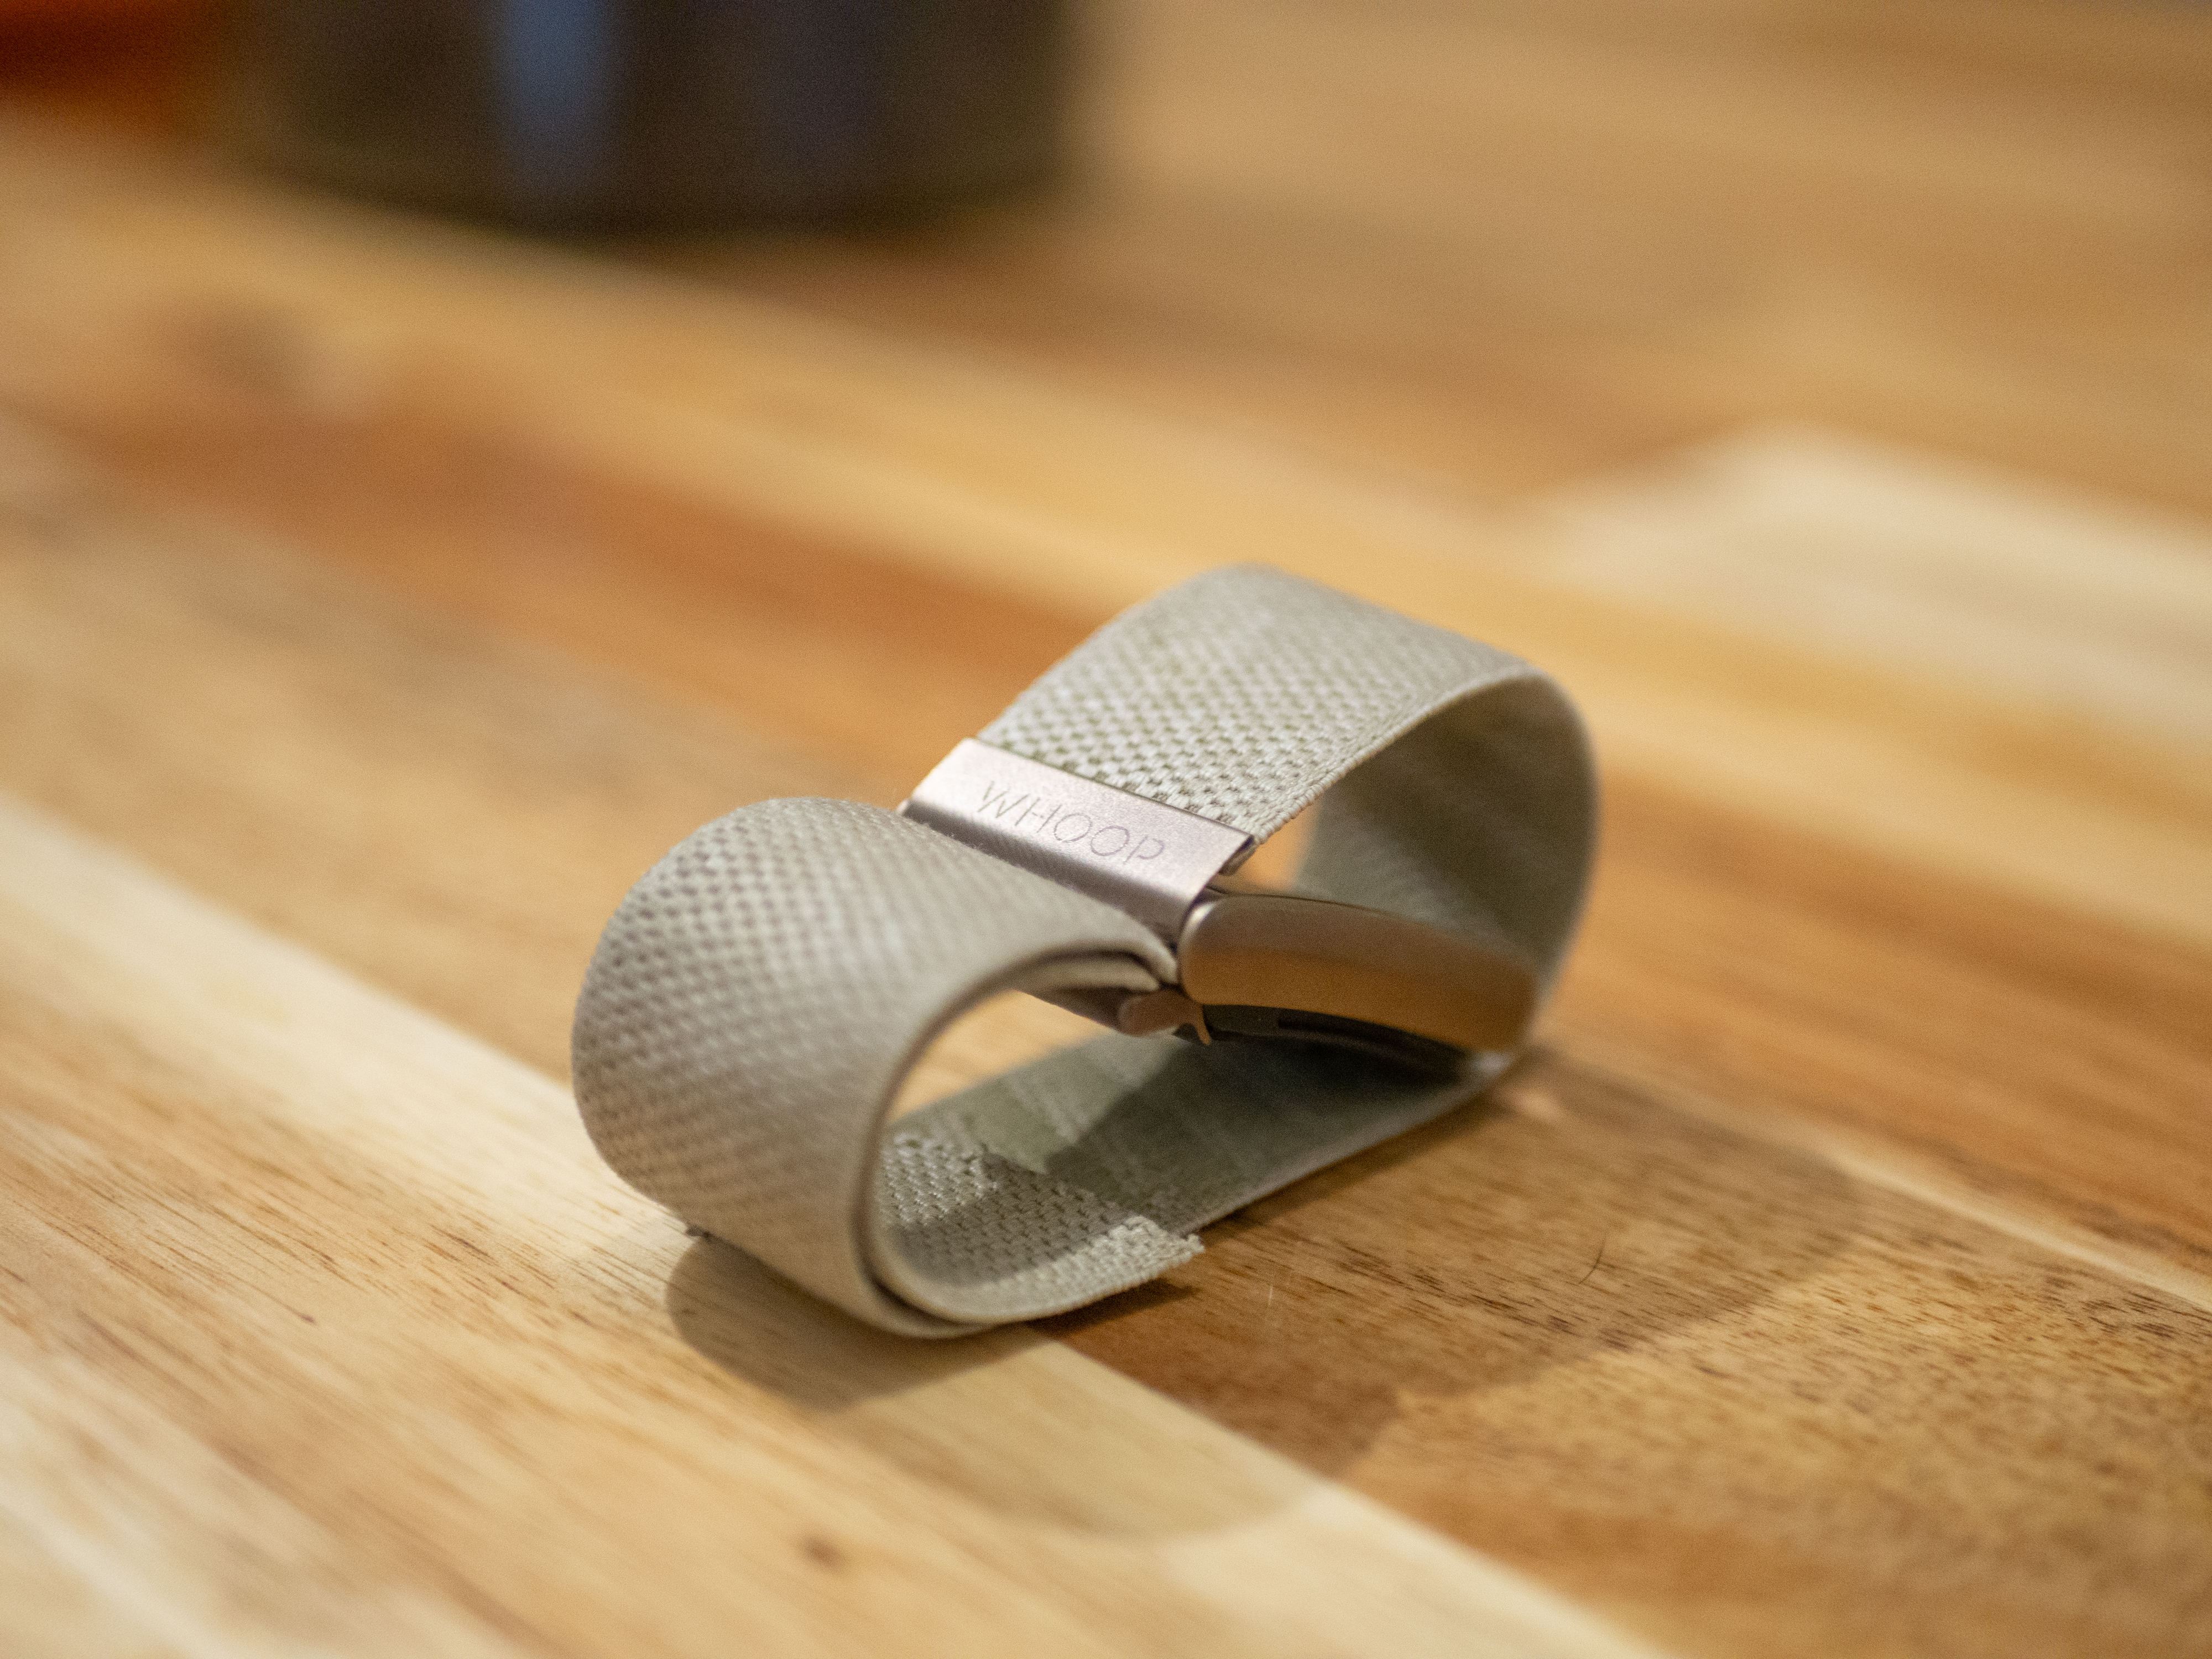
Price: £27.00 / $30.00 per month | £229.00 / $239.00 annual | £384.00 / $399.00 bi-annual
Dimensions: 25.0 mm x 35.97 mm x 10.1 mm (sensor)
Weight: 28.5g (with strap)
The Whoop 4.0 is best described as a wearable health and fitness tracker. Many people liken it to a smartwatch, and it currently features in our guide to the best heart rate monitors, but it's in a niche category, with more established competition from smart rings such as Oura and Ultra Human than the wrist-based wearables from the likes of Fitbit or Polar.
It is a subscription based product. You can either pay monthly at £27 / $30 per month (for a minimum of 12 months), or sign up for a one-year or two-year subscription at £229 / $239 or £384 / $399 respectively.
It's a fairly unique product. At first glance, the price tag seems crazy for a product that has no GPS, can't do notifications, can't do contactless payments and won't play music. In fact, there's no screen so it can't even tell you the time.
But to compare it to a smartwatch is unfair. It's not a watch, it's a Whoop; the fourth iteration of a device that is worn simply to serve one primary purpose: Monitor your metrics.
And it does so constantly, both day and night. It is IP68 waterproof and you can even charge it in situ, so you never need to take it off. Quite literally, it doesn't miss a beat.
It tracks your heart rate, heart rate variability, respiratory rate, blood oxygen, skin temperature and more. Using this "full physiological profile" as the brand calls it, it is able to track workouts, monitor sleep, calculate calorie burn, judge daily stress and a whole host of other nerdy measurements, which I'll get into.
When you get into the weeds, you can very quickly become overwhelmed by all the data, but its primary outputs come in two easy-to-comprehend scores each day: Recovery and Strain.
It is worn by countless professional athletes across all manner of sports. Most notable in cycling are the Dutch sensation, Mathieu Van der Poel, and the current men's Unbound champion Lachlan Morton, but there are hundreds of others besides. A brief look at thefreshstrap.com informs me that Whoop also counts LeBron James, Michael Phelps, Tiger Woods, Cristiano Ronaldo, and Patrick Mahomes among its wearers.
I've been wearing the Whoop 4.0 for over three years, and we've been through a lot together. During this time, I've used it 'actively' – checking the scores each day to inform my behaviours – and 'passively' – checking in every so often for little more than curiosity.
I've worn it alongside a chest-based heart rate monitor for somewhere in the region of 1000 workouts. I've worn it through a period of serious training, through quite blatant physical burnout, through a bout of Covid, and even on a handful of very boozy nights out. I've joined the infamous '1% Club', and I even wore it for a 270km ride which I did on about 2 hours sleep.
I've gone through periods of loving it and hating it, I even stopped wearing it for a while because it was doing more harm than good.
I'm afraid I'm not a professional athlete like Mathieu, Lachlan, LeBron, or Cristiano, but that does mean I'm probably more like you… so here's my honest, transparent, all-the-gory-details three-year review of the Whoop 4.0.
Design and specifications
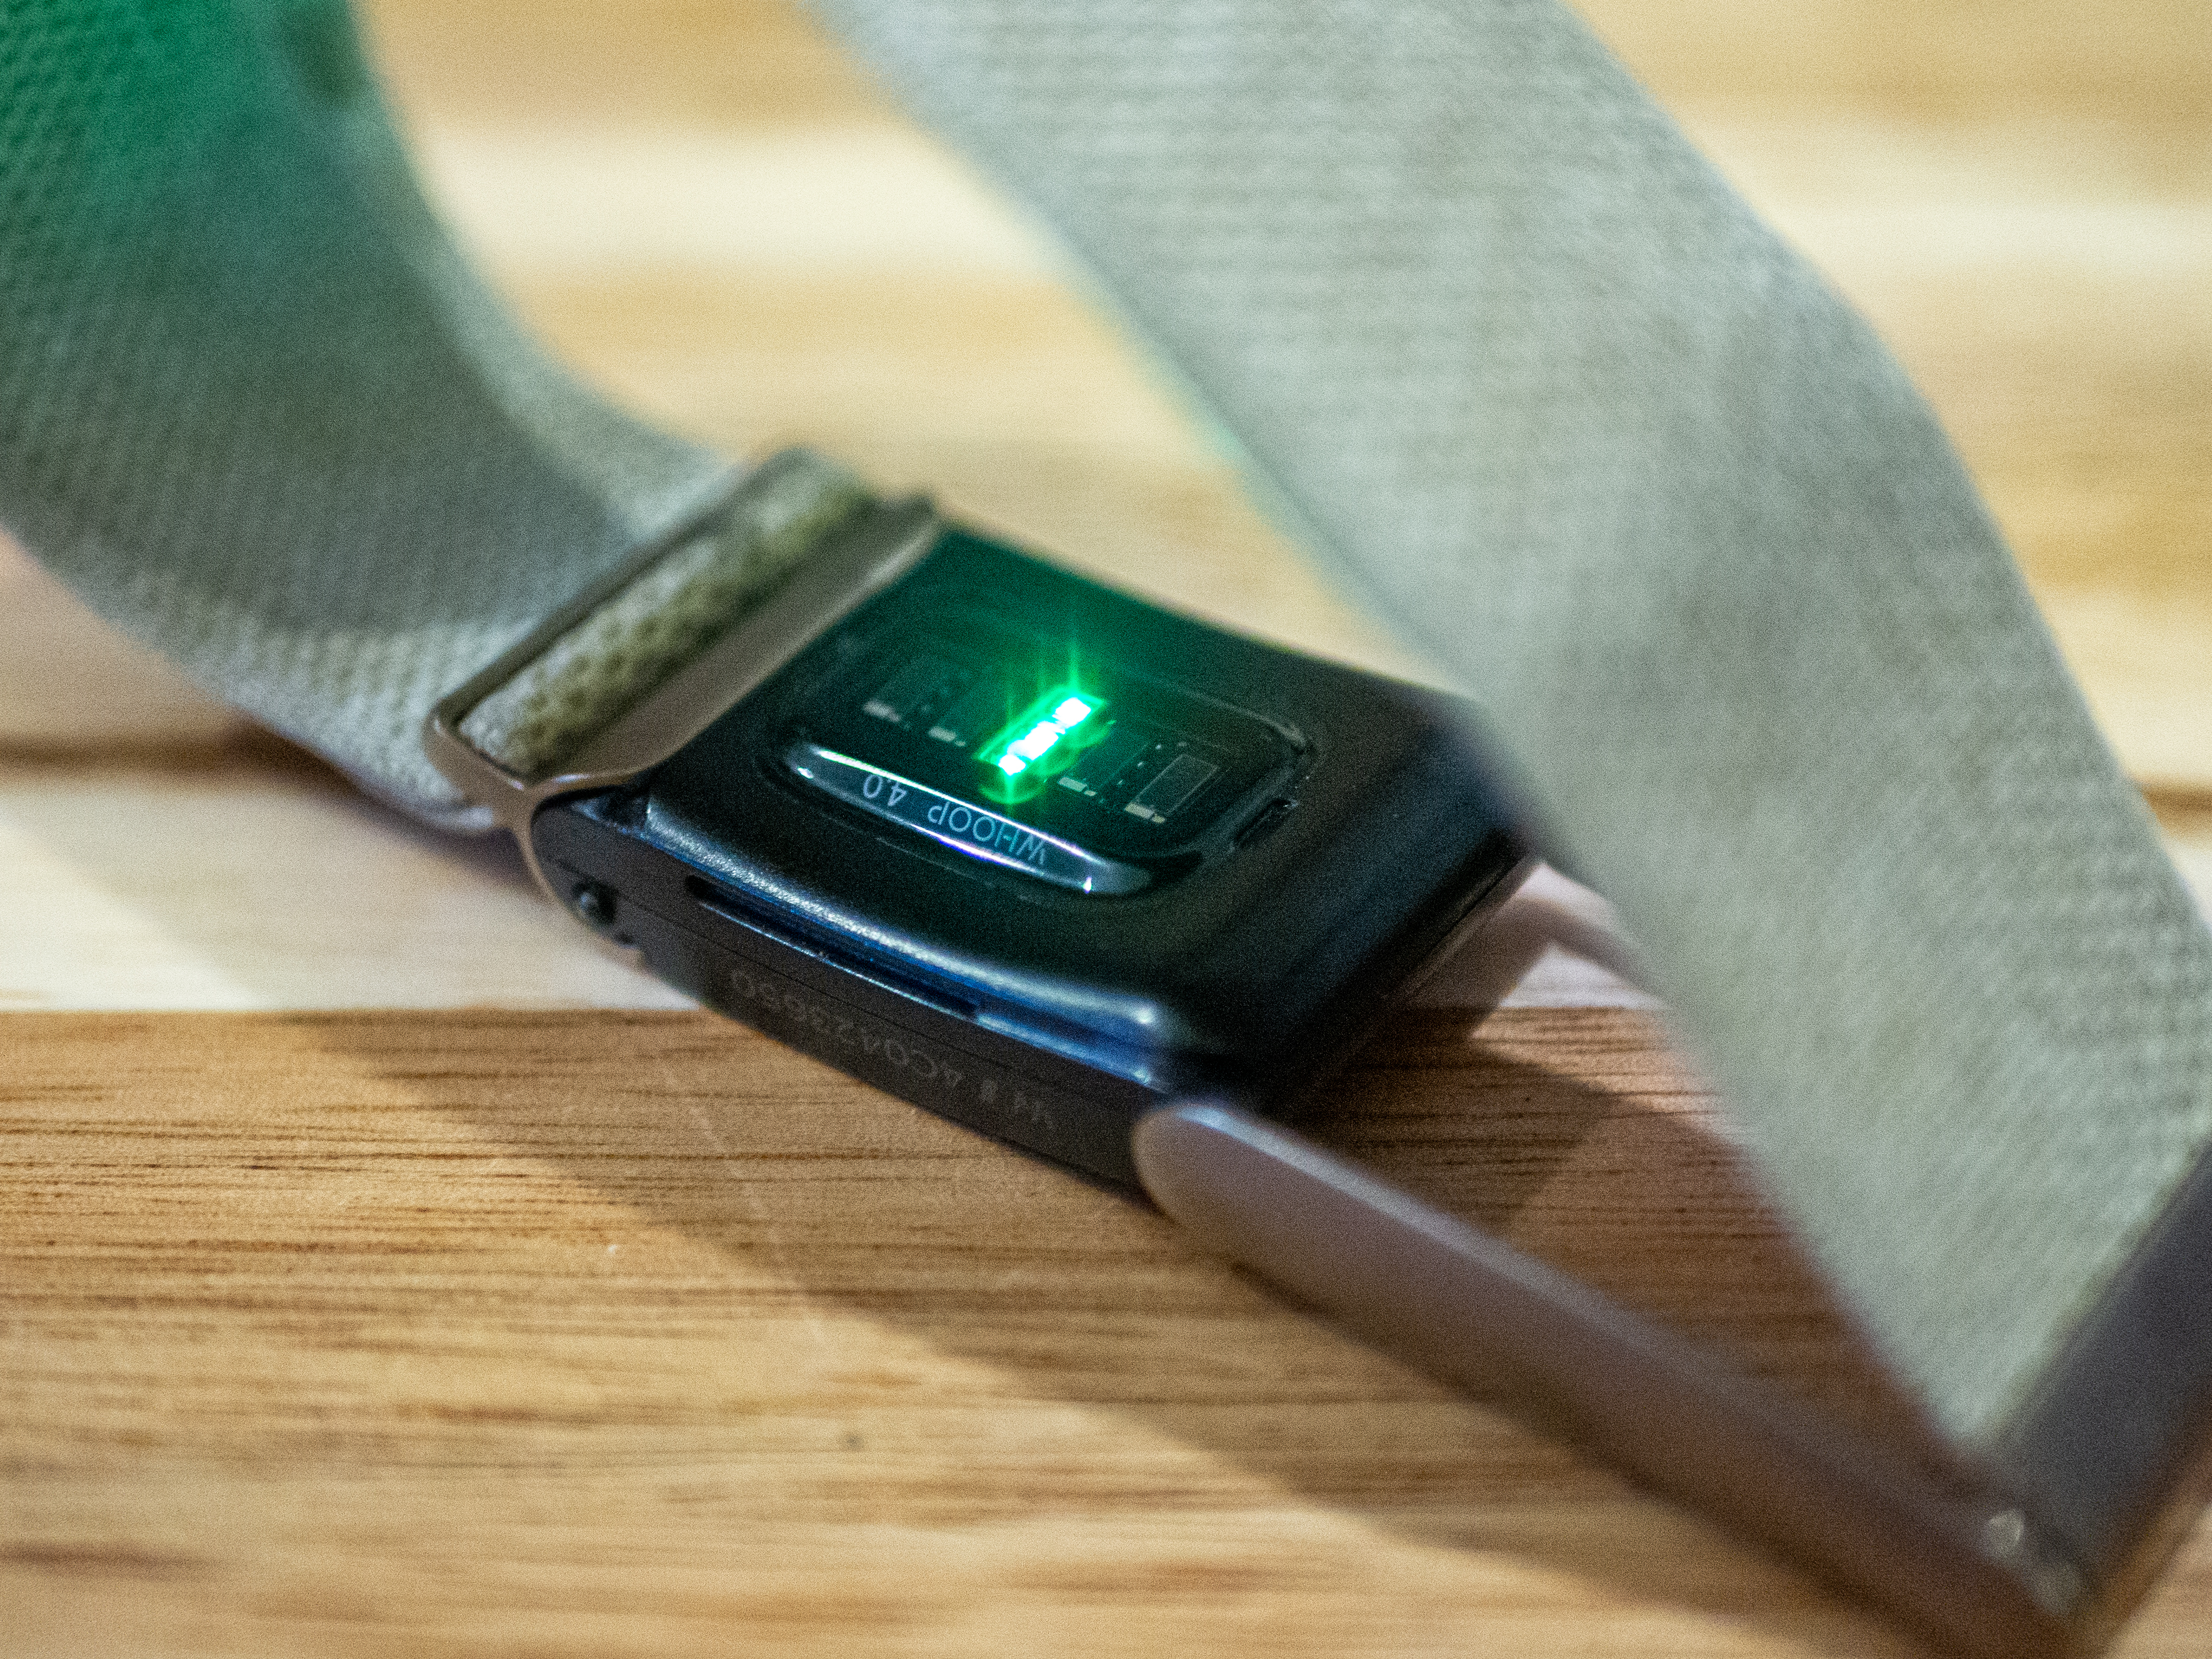
Let's start with the physical attributes and the important bit of the Whoop 4.0, which is the small black sensor pod that houses all the tech: Primarily the five LEDs (3 green, 1 red, and 1 infrared) and four photodiodes.
A quick science lesson for anyone interested: The sensor works using photoplethysmography (PPG) which essentially shines green LED lights into the skin, and measures whatever light is reflected to determine changes in bloodflow, thereby calculating your heart rate, variability and so on. For completeness, the red light is used for measuring blood oxygen saturation (Sp02).
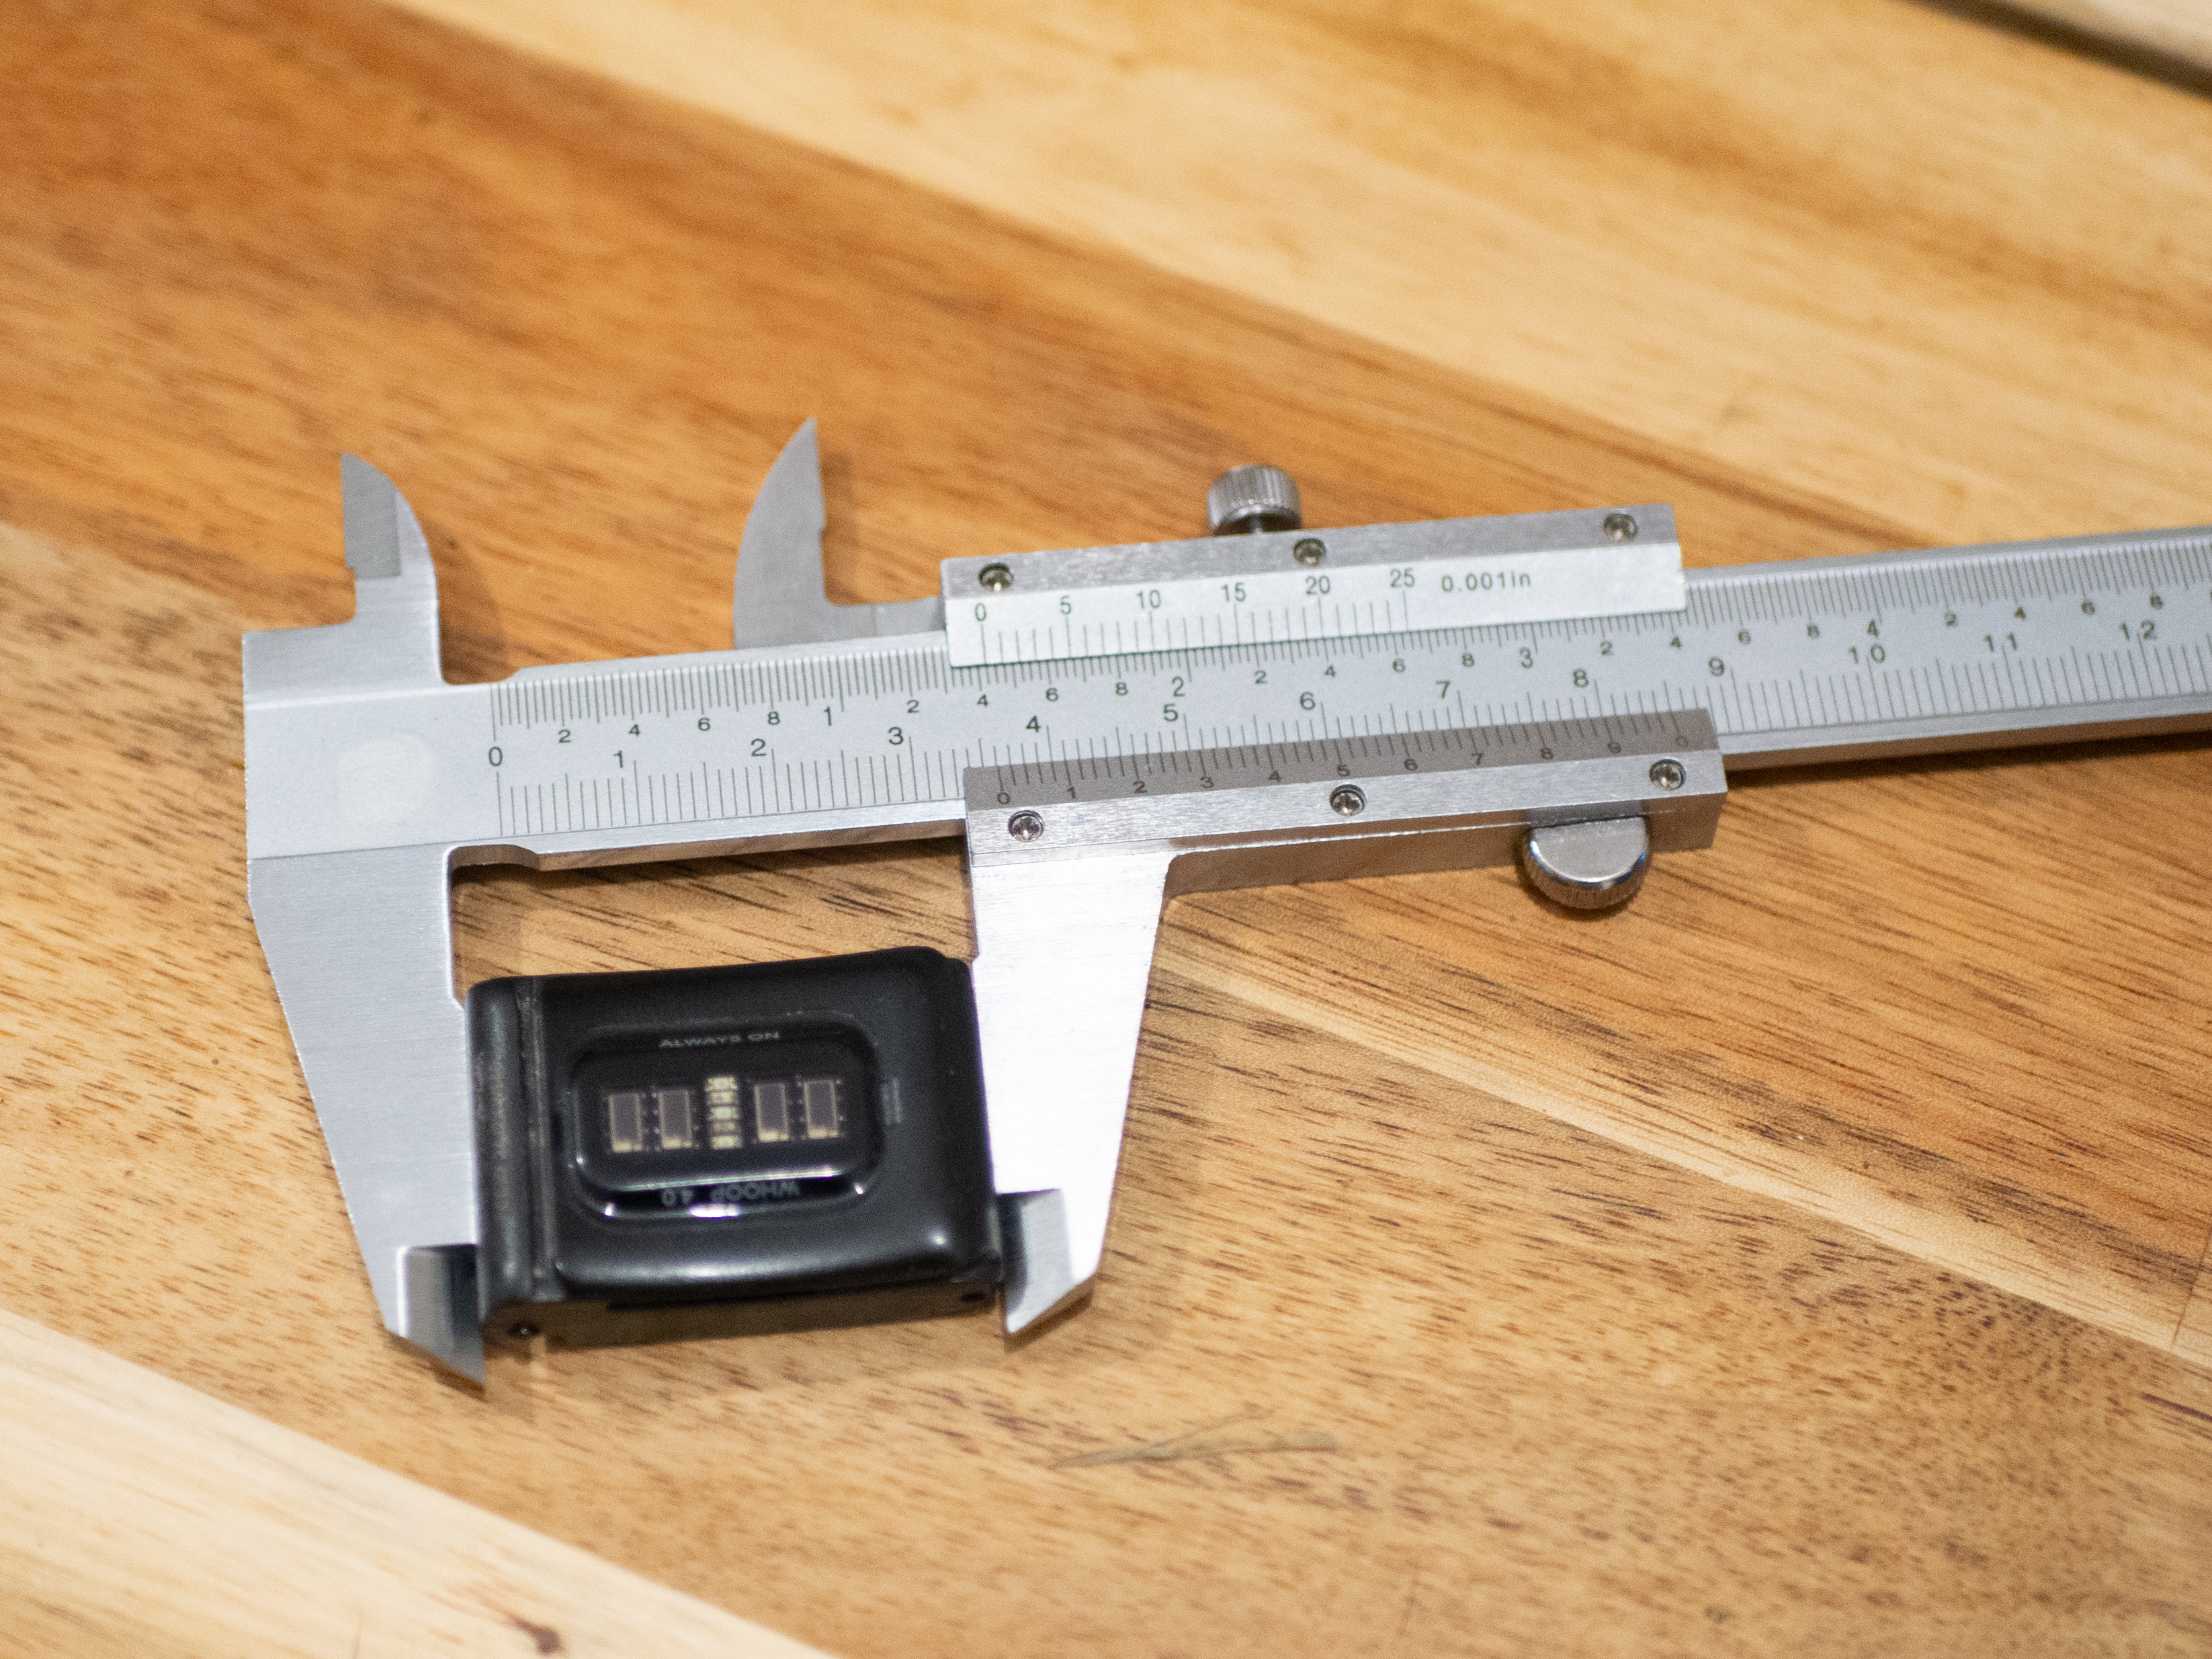
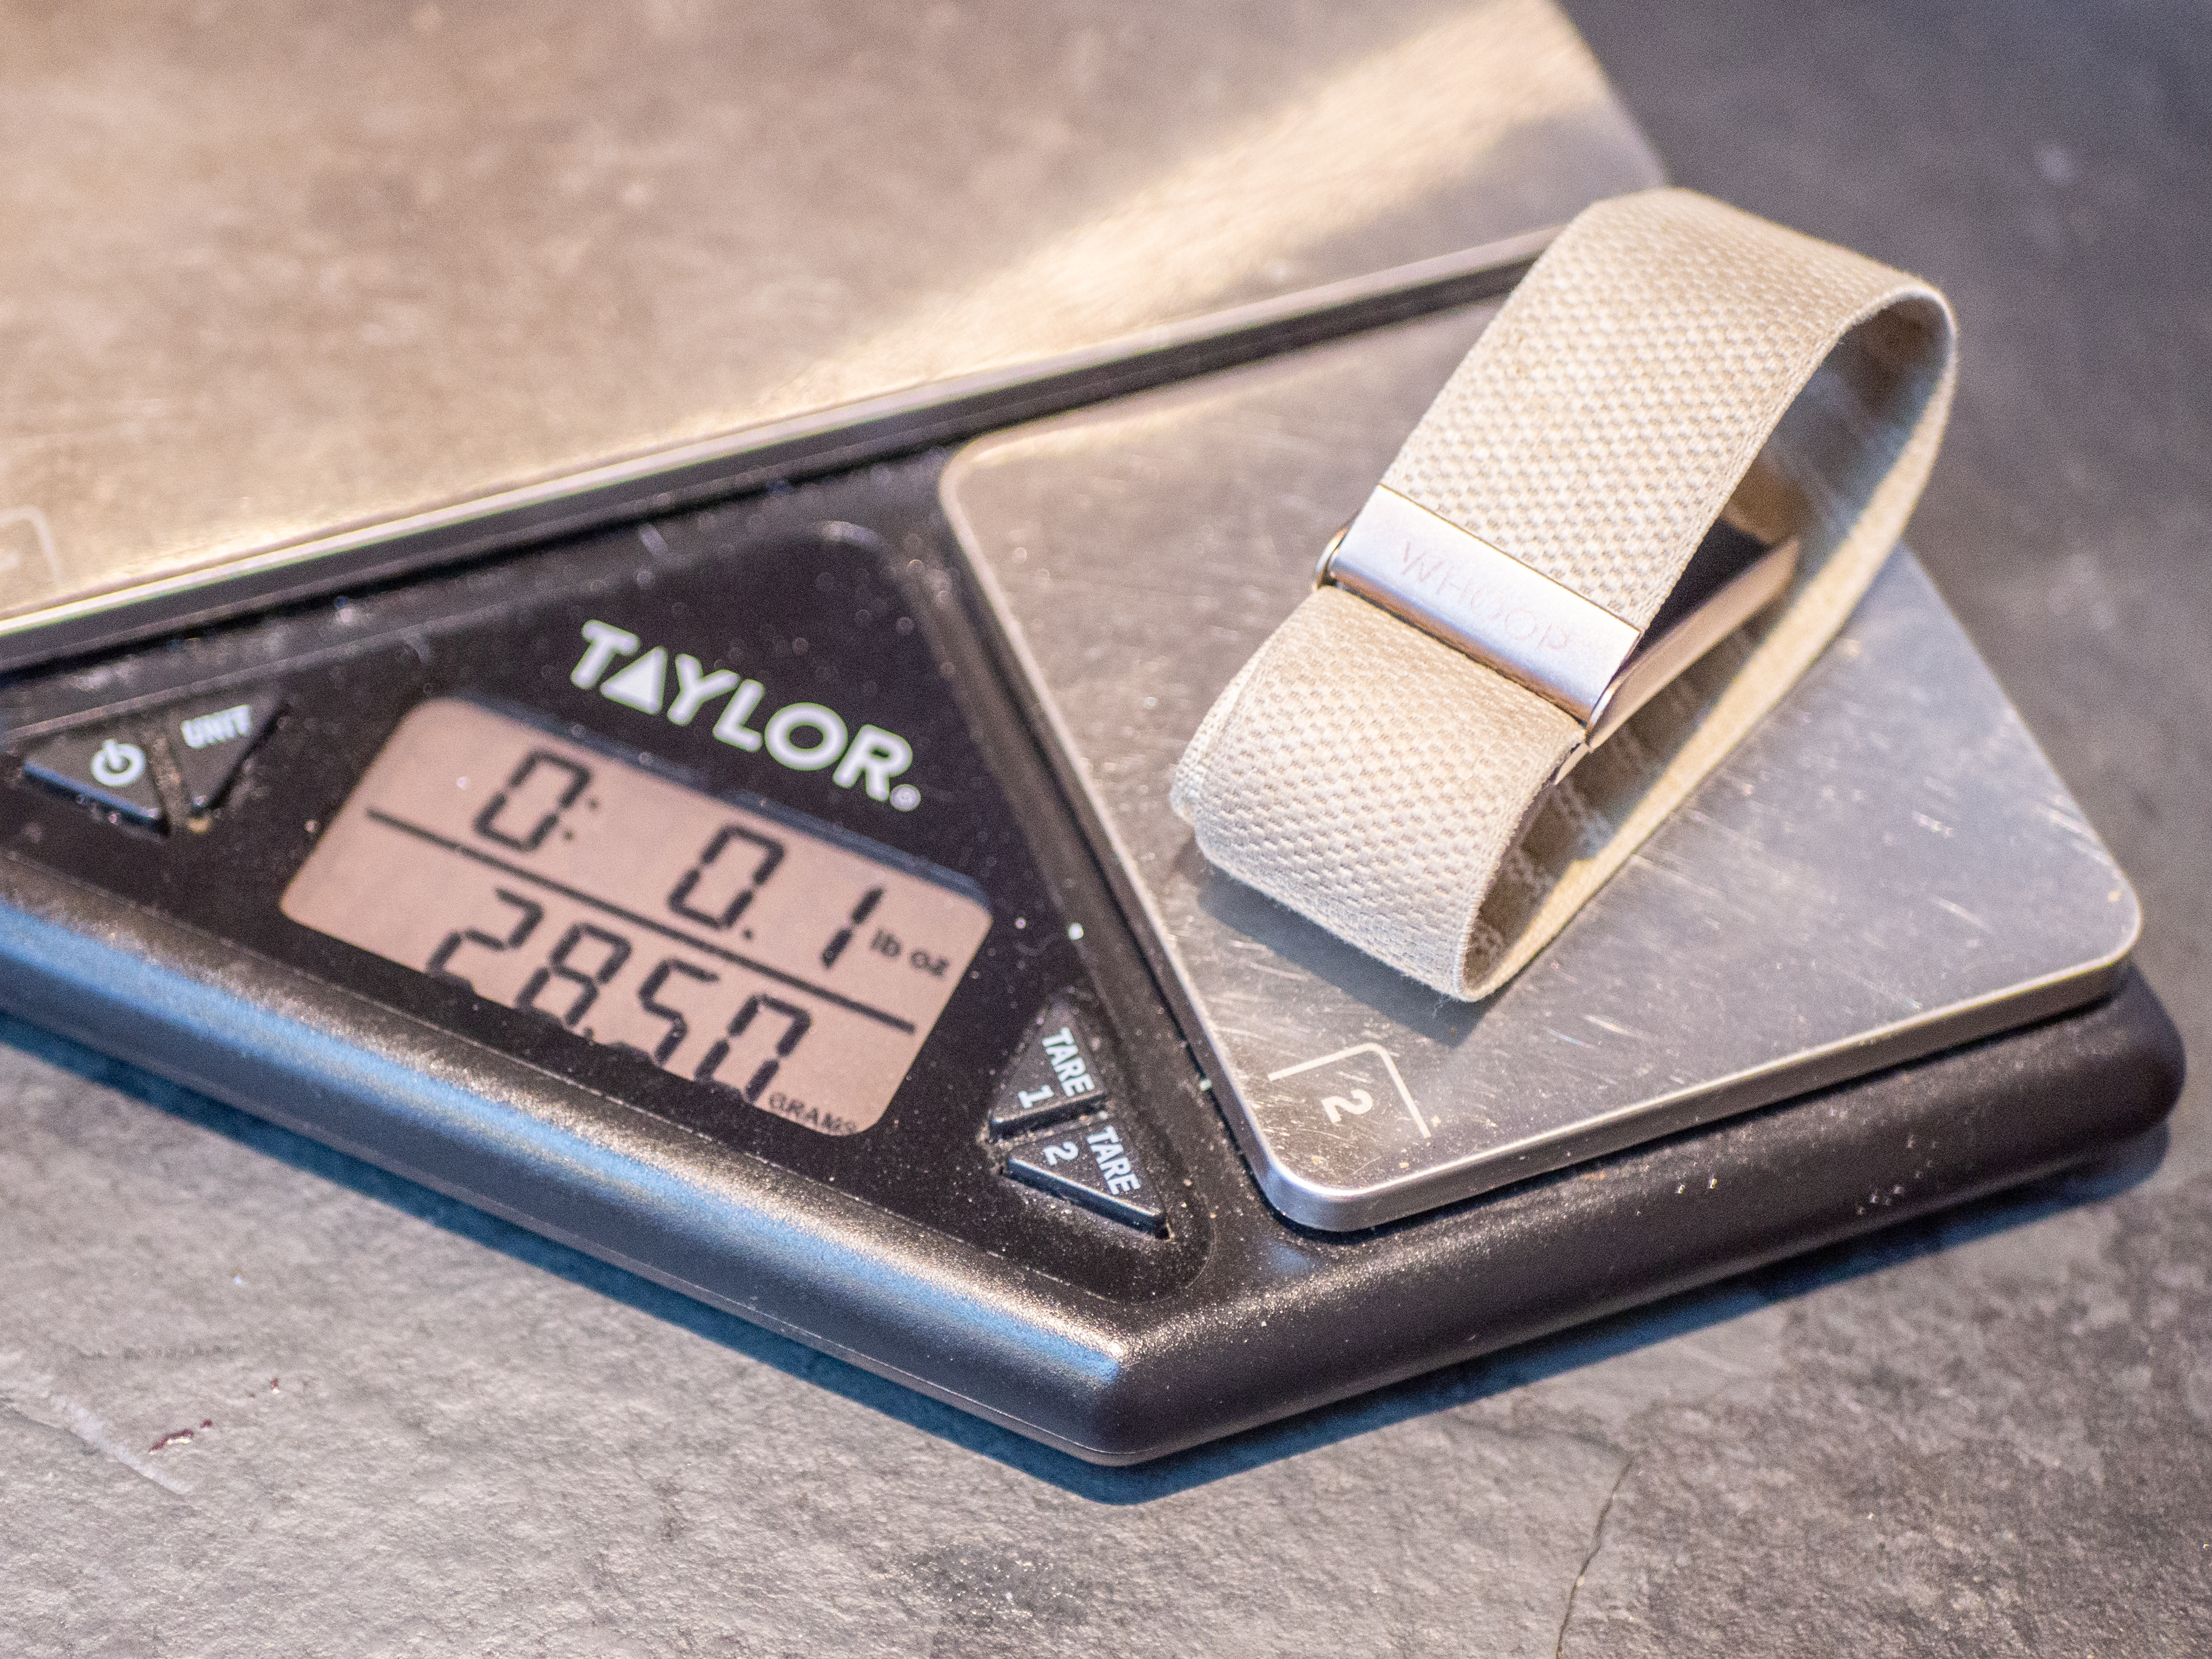
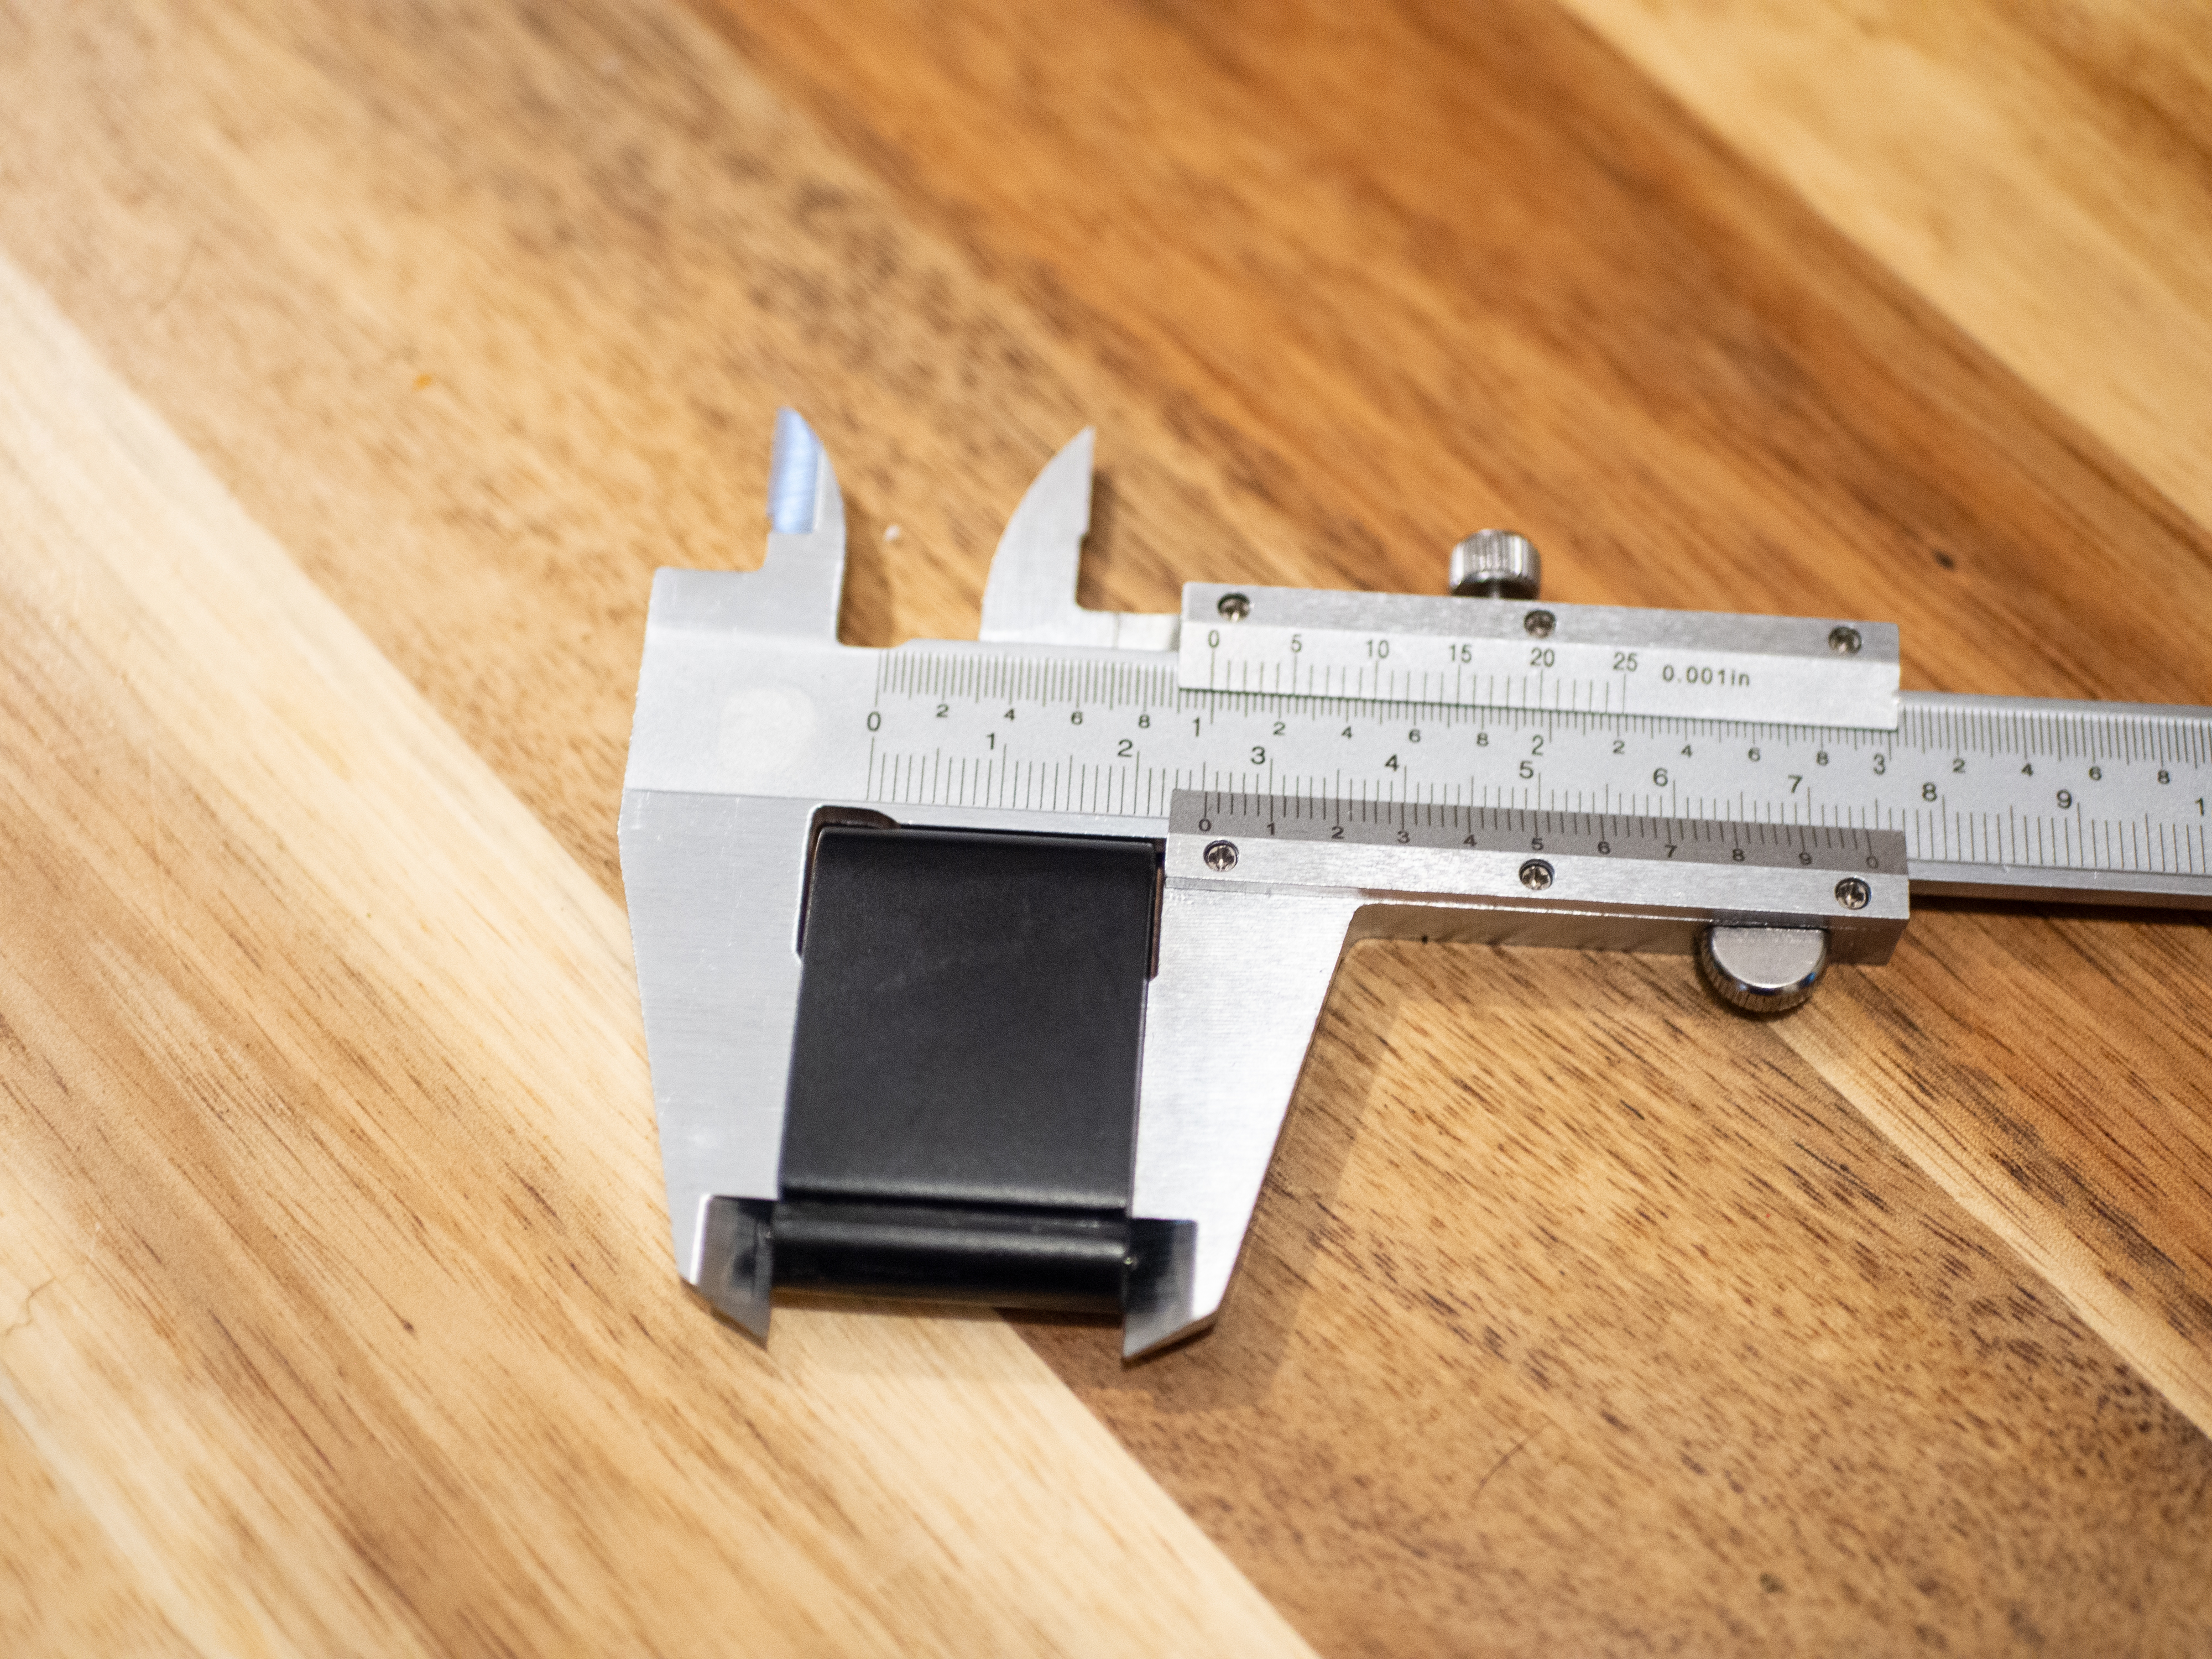
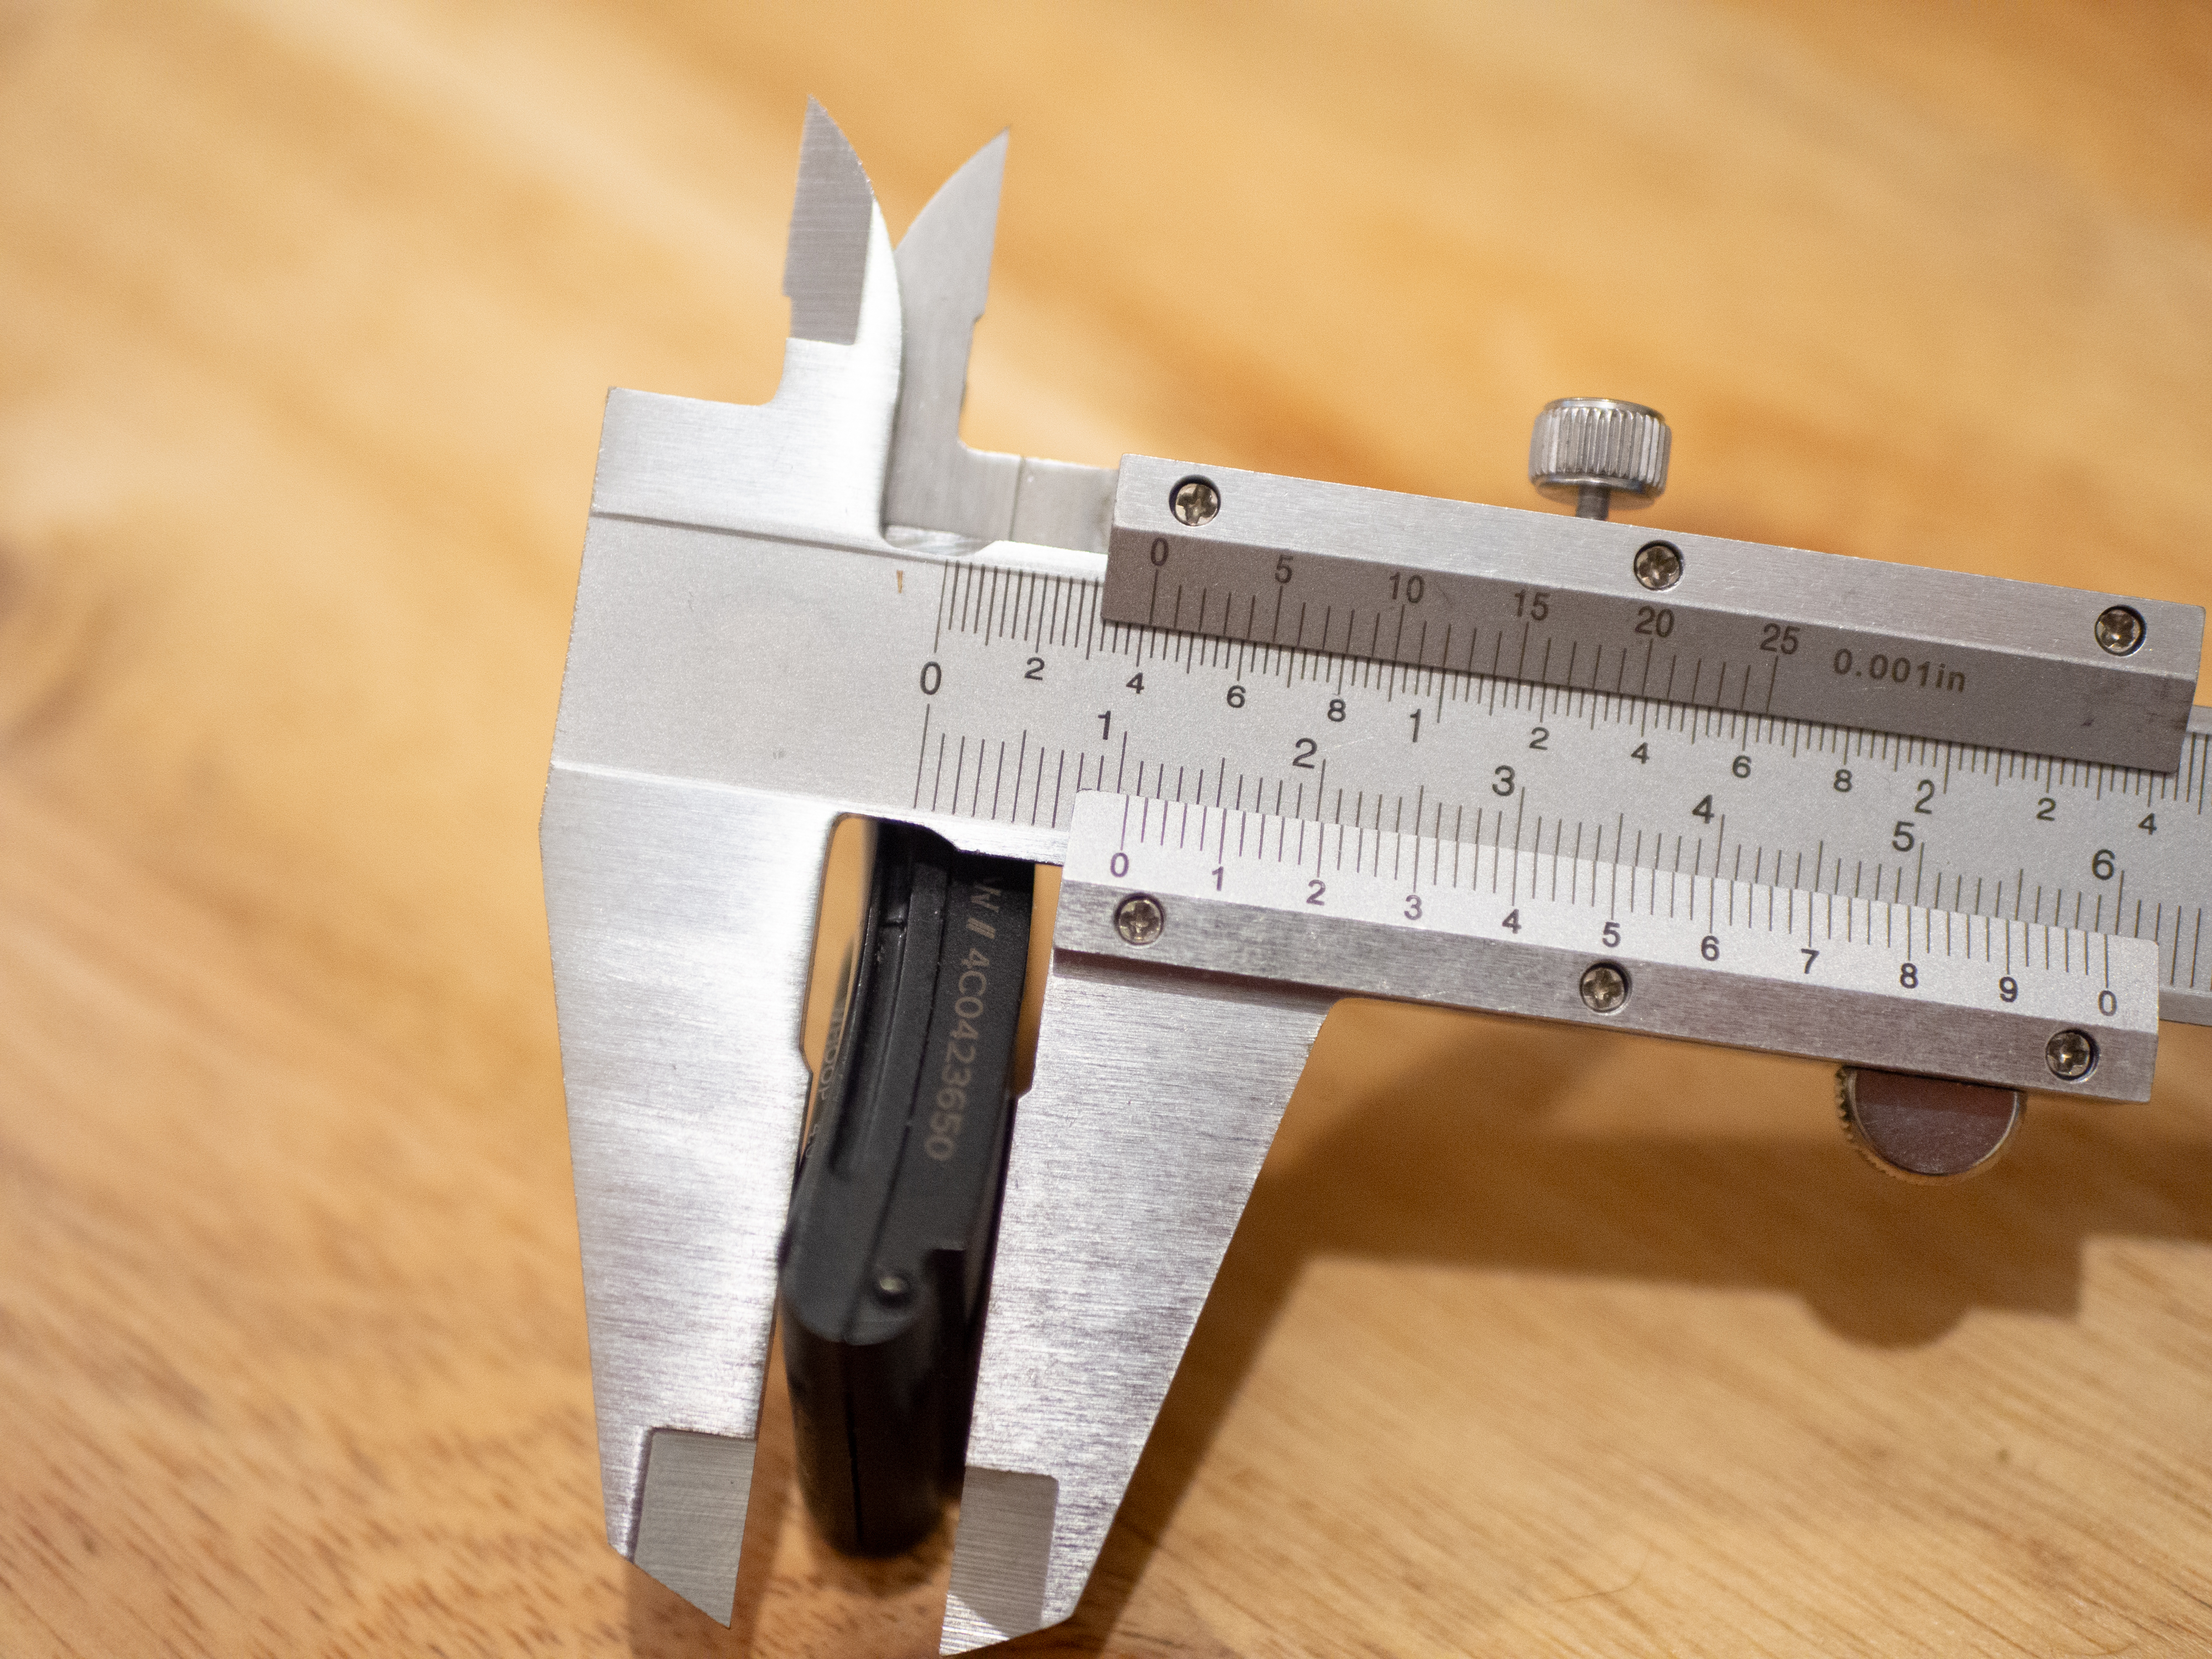
The pod itself is 33% smaller than the predecessor, at 25.0 mm x 35.97 mm x 10.1 mm. With a strap attached, the whole thing weighs just 28.5g. It's unobtrusive, largely comfortable - although it can sometimes cause irritation and soreness, as I'll get into below.
It comes with a standard black strap with a black clasp, but both can be replaced with coloured aftermarket versions, as per the sand-coloured version shown above. You can also buy Whoop-branded clothing, including underwear, shorts, compression tops, sports bras, and even Assos bib shorts, which come with a small pouch that places the sensor against your skin. I have used the Assos shorts, as it happens, though not extensively, but suffice it to say I found the heart rate data to be accurate while using them.
As mentioned, there's no screen on board, so all of the data being collated is displayed in the Whoop smartphone app.
Strain and recovery
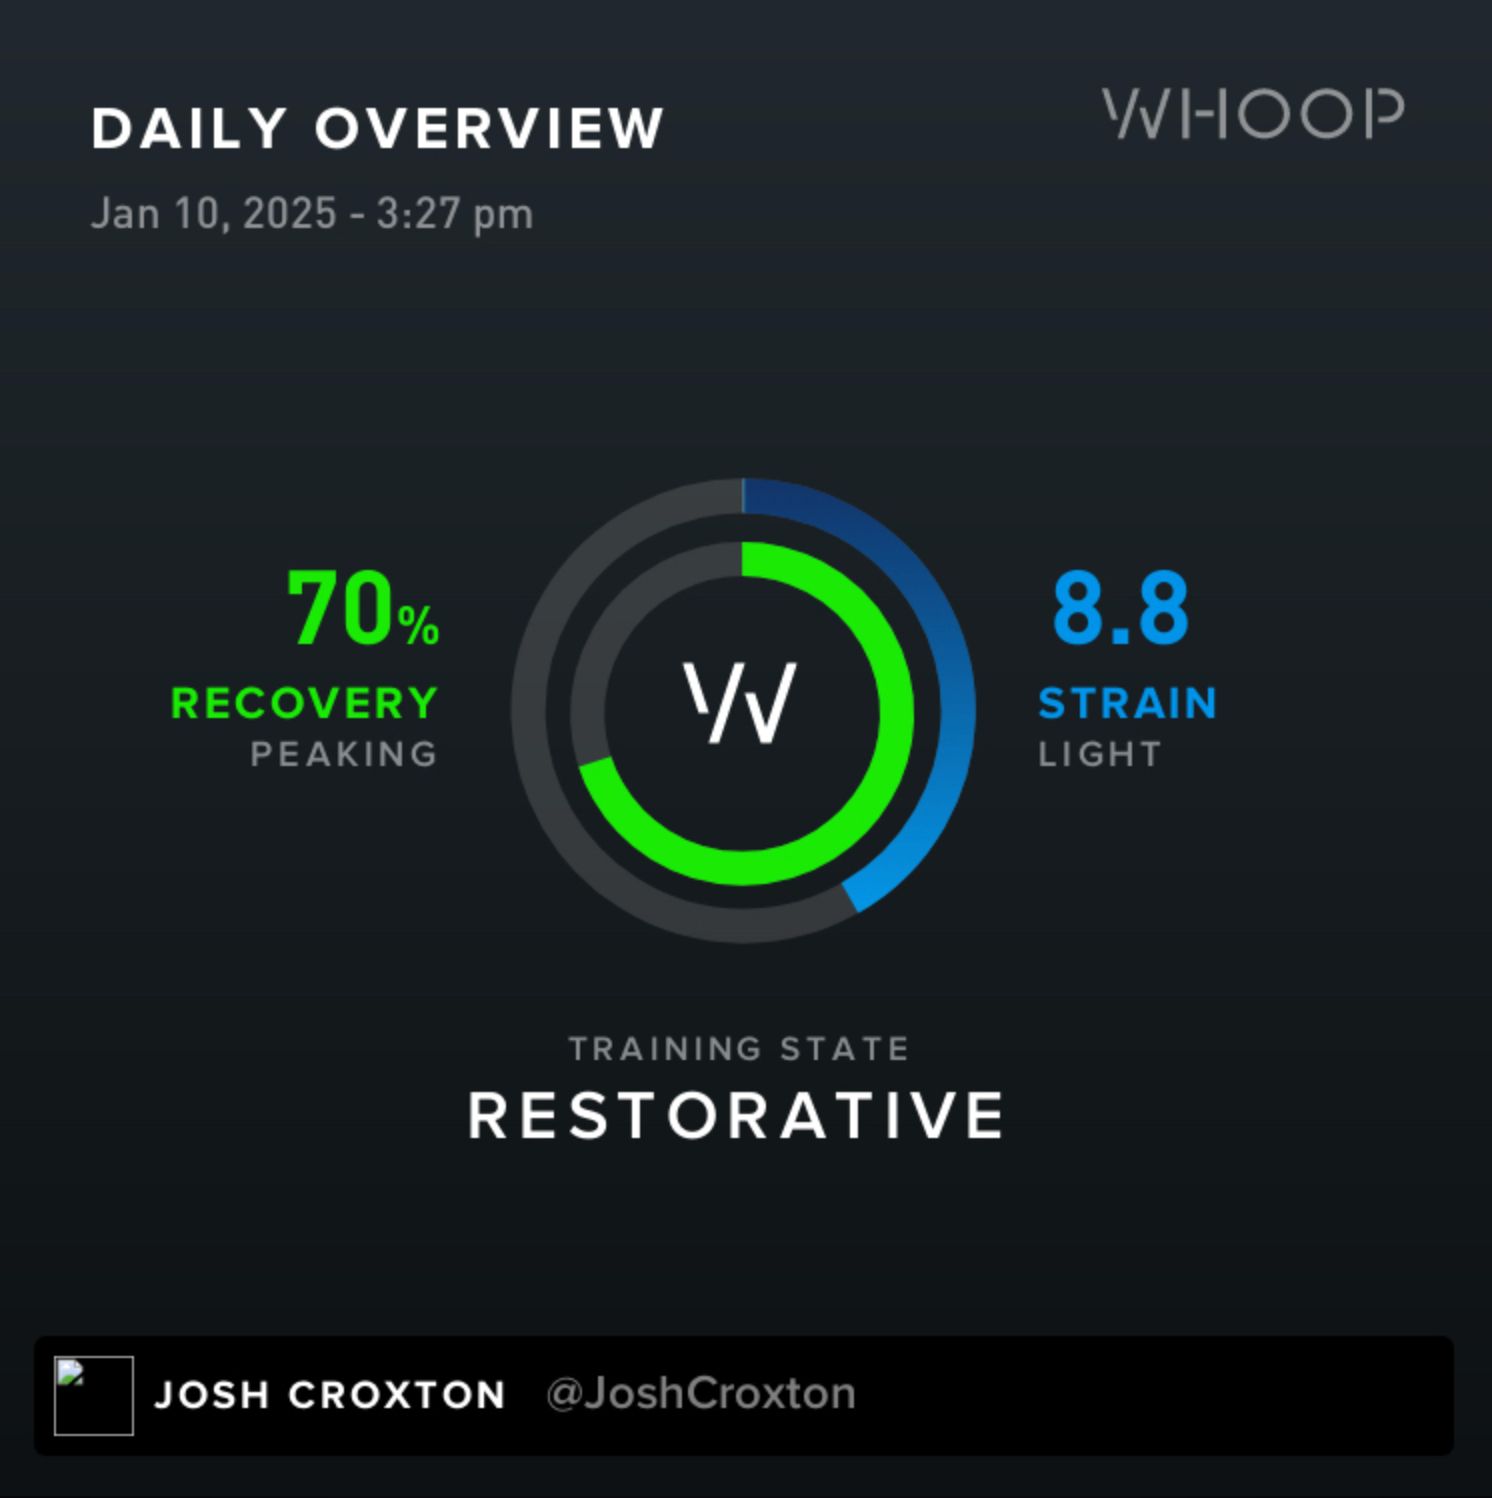
While it's a bit unfair to simplify the Whoop 4.0 down to two functions, it's important to start by focusing on Strain and Recovery – its two primary outputs.
Strain is a score out of 21, and is built throughout each day in line with your activity level. Crucially, this isn't just a reflection of your workouts, but your entire day. Stressful work days, hard rides, dog walks, and anything else you do that elevates your heart rate will contribute to building Strain.
It is built using an algorithm, and while the specifics of that algorithm aren't published, the important thing to know is that it works as expected. In my three years of use, it has consistently tracked well with my perception of the day. Days with hard rides are higher than those without. Stressful workdays, busy travel days, hard races and illnesses are the ones where strain builds more quickly.
Recovery is the other side of the coin and is another proprietary algorithm-based score, only this time it's a percentage score out of 100. As you stress your body, it reacts. For example, your resting heart rate and respiratory rate will increase, and your heart rate variability (HRV) will decrease. The rate at which it does this is individual and personal, but by tracking these metrics while you sleep, Whoop can learn your responses and, in turn, calculate how well-recovered you are and your body's readiness to take on more strain the next day.
With these basics in place, Whoop then guides you toward behavioural changes to improve your recovery. Exactly how it does this, I'll explain below.
But first, It's easy to get lost in the terminology and lose sight of the real-world implications of these daily figures but while Strain - capital S - is a numerical score, it's very much a reflection of the strain - lowercase s - or the stress that you put on your body each day.
Likewise, Recovery - capital R - is a percentage, similar to Garmin's Body Battery, but it is a reflection of your body's state of recovery - lowercase r. I don't see it as a literal gauge of my body's capacity like my iPhone battery or my car's fuel gauge – not least because I've never hit 100% recovered – but it's a good indicator of how well-rested I am and a figure I can use as a guide for how hard I push my training that day.
Sleep tracking
Forget all the expensive tech such as massage guns, compression clothing and cryotherapy. By far the biggest lever most amateur athletes can pull in order to improve recovery is getting better sleep, and in my opinion, this is where Whoop really shows its worth.
Importantly, it is able to work out when you go to bed, when you fall asleep, and when you wake in the morning. It's not minute perfect, and if I wake up in the morning but don't get out of bed immediately – eg, I scroll social media for 15 minutes – it gets a little blurry. But on the whole, it requires no input whatsoever, which is crucial, as otherwise I would definitely forget.
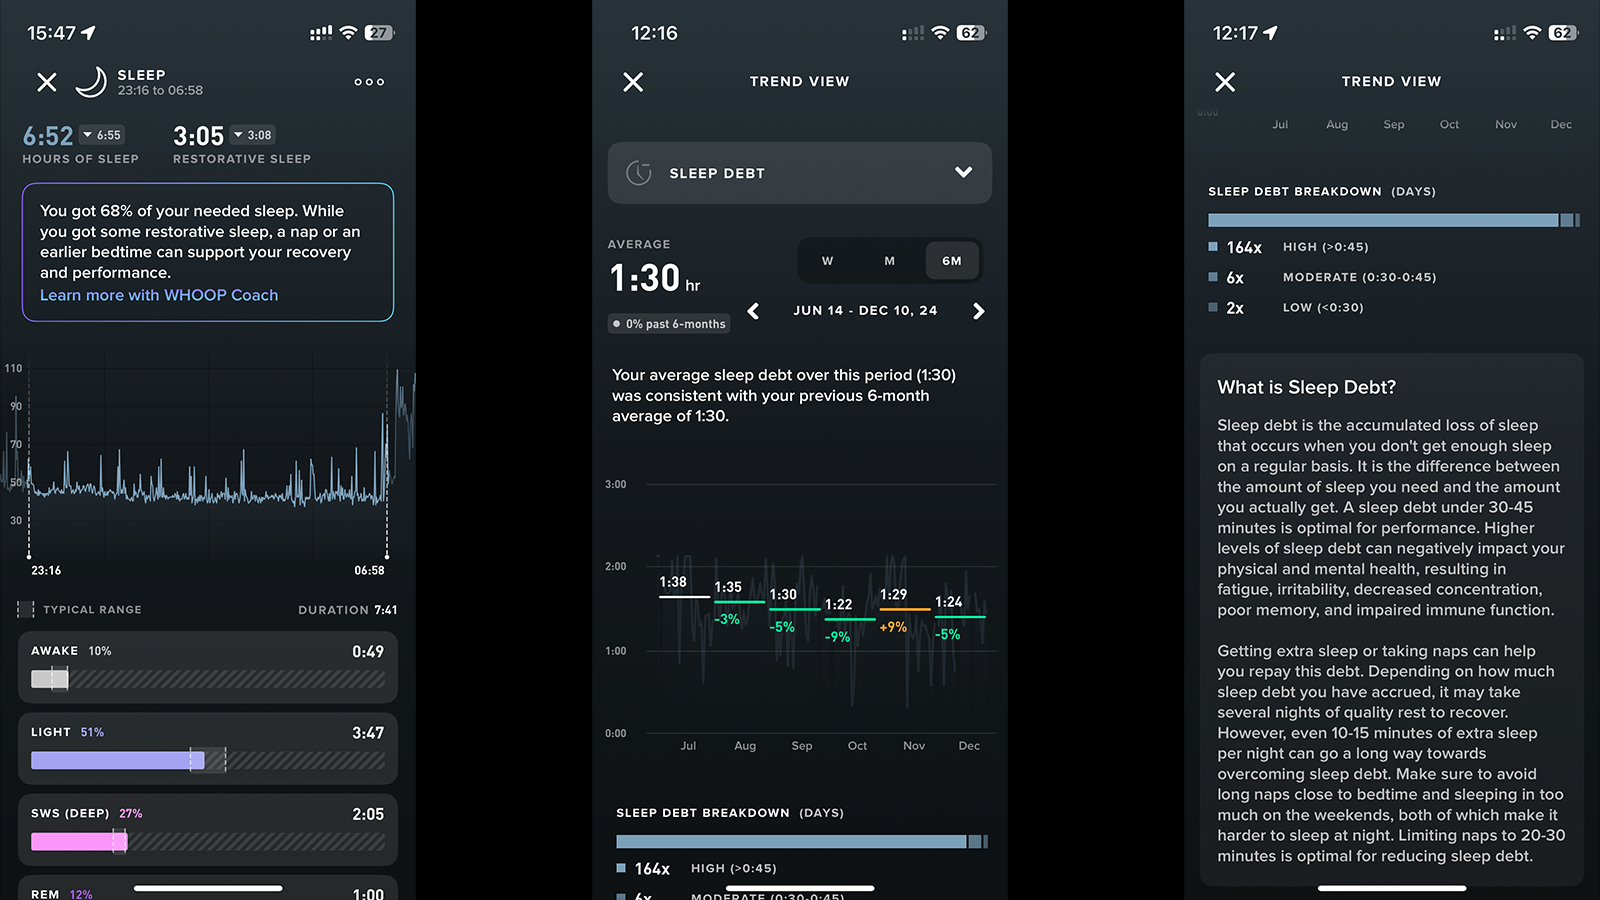
Specific to sleep metrics alone, each and every night, Whoop tracks the following:
- Time in bed
- Sleep latency (the time between getting in bed and falling asleep)
- Sleep efficiency (time spent asleep divided by time in bed)
- Sleep and wake times
- Your different stages of sleep (SWS Deep, REM, Light, Awake)
- How often you wake per hour
- Sleep consistency (aka your sleep & wake times over a four-day period)
- Hours vs need (need being a calculation of the amount of sleep you need to recover fully
- Sleep debt (An accumulation of lost sleep over time)
- Sleep performance (A calculation of hours divided by need)
- Restorative sleep % (the hours spent in SWS Deep and REM)
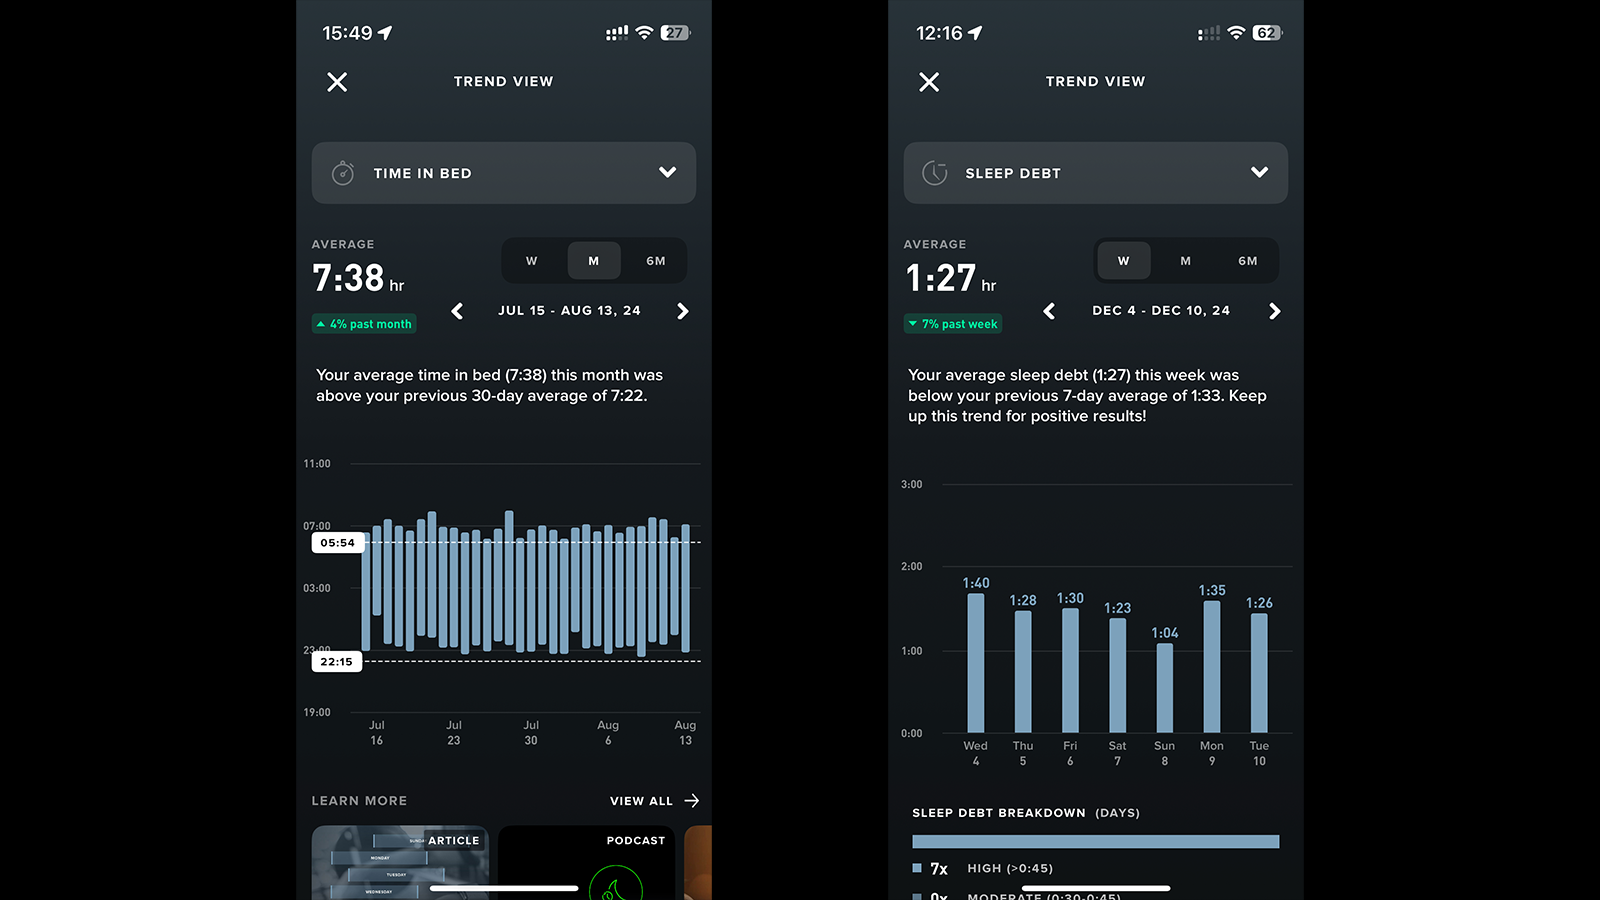
Each of these data points is then graphed out over the recent week, past month, and monthly averages over the most recent six months, with all historical data available too, allowing you to see short and long-term trends.
From my own data, I can see that my sleep efficiency is excellent - averaging around 92%, but that I very rarely get as much sleep as I need, with an average Sleep Debt of 89 minutes this past six months. But like most normal people, as an amateur athlete with a busy life and a full time job, I rarely have the opportunity to take naps during the day, so how valuable this insight is is up for discussion.
Sleep planning
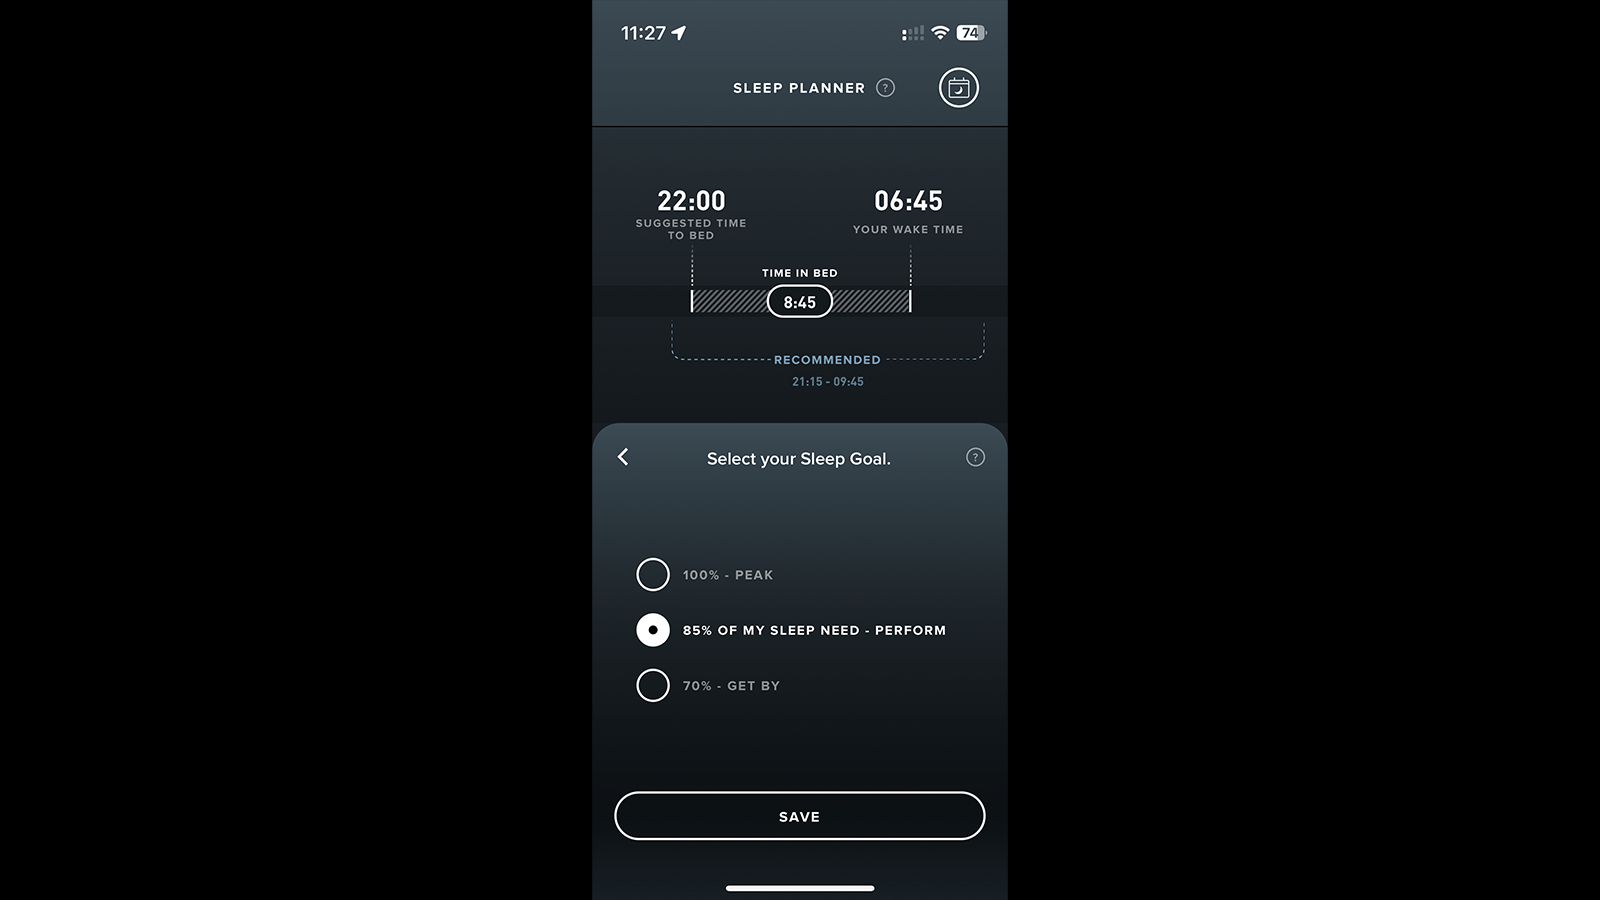
For those who can be a little more proactive in their sleep schedule, the Whoop app helps you plan your night ahead. The app's Sleep Planner lets you choose a recovery score for the following day – out of 'get by at 70%', 'perform at 85%', or 'Peak at 100% – and guides you towards the optimal night's sleep. This guide centres on how much sleep you get, and suggests what time you go to bed and what time you should wake in order to hit the chosen recovery percentage.
The Whoop 4.0 also has an inbuilt alarm, which uses the device's haptic feedback – vibration – to wake you gently. You can set this for a specific time, or it can be triggered when the app calculates you've had enough sleep to hit your pre-selected recovery score.
Coaching
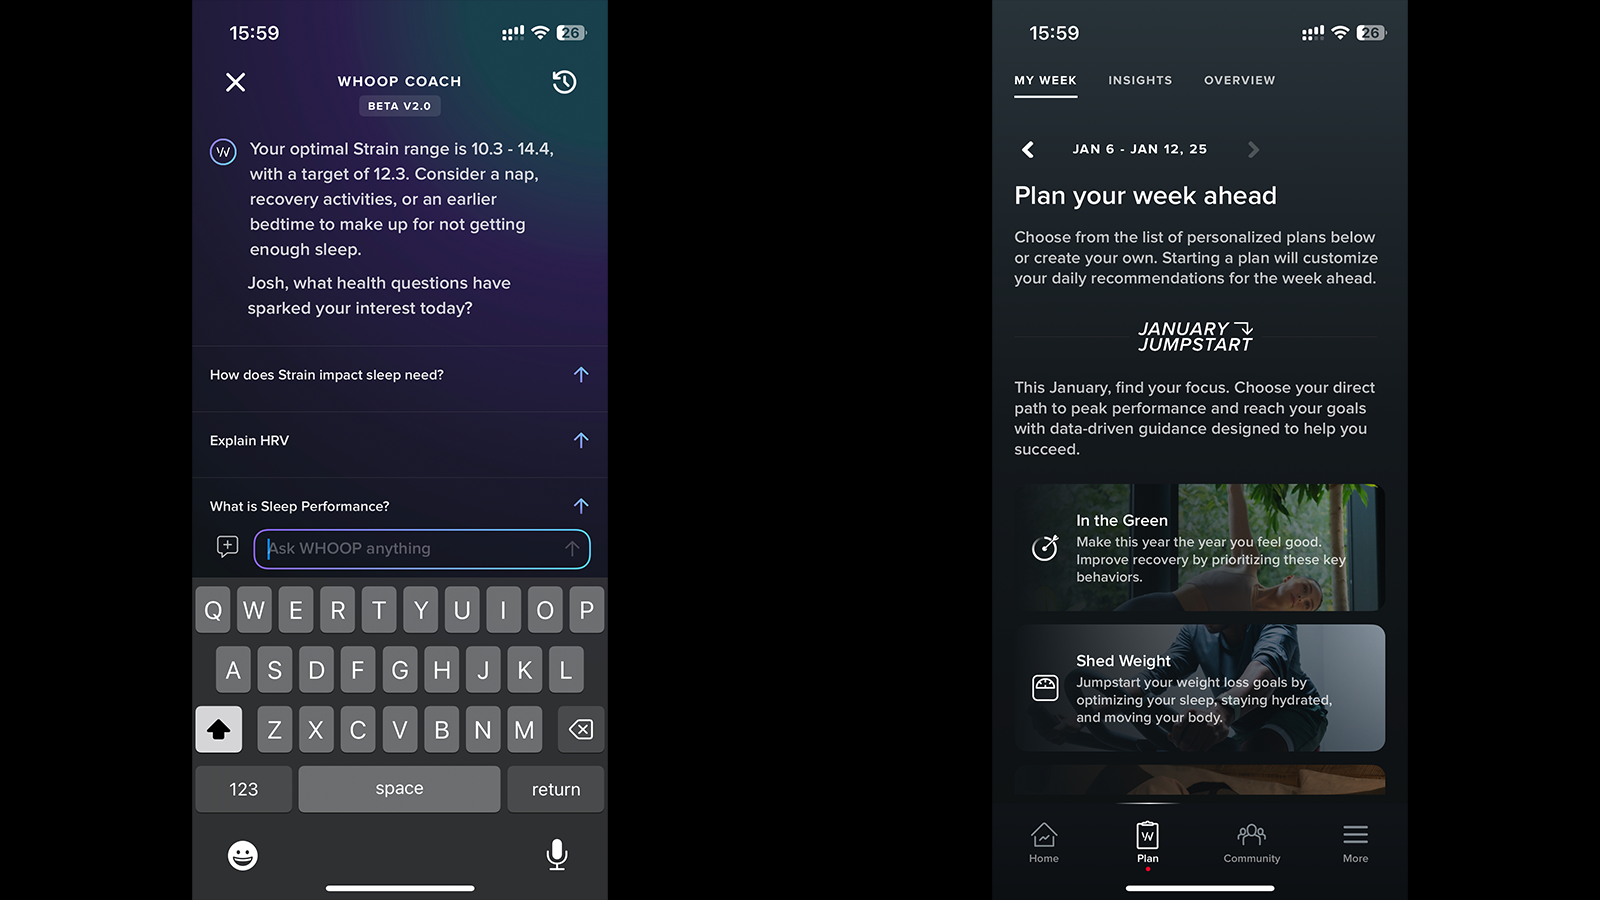
The Sleep Planner is just one of a variety of the metrics that the Whoop 4.0 can provide guidance and coaching. In September 2023, the app integrated an AI chatbot which you can ask questions about your data, but even without that, the app is holistically designed to guide and educate you.
For example, within each of the specific datapoints, there is an explainer that tells you what it means, what affects it, how it's measured or calculated, and what the implications of a good or bad result may be. Further reading is then linked, which takes you to the rich database of explainer articles on Whoop's website.
And on the subject of coaching more generally, each day it will provide you with an optimal Strain range for the day on the app's homepage, alongside daily behavioural recommendations. Today, for example, mine reads: "Your optimal Strain range is 9.6 - 13.6, with a target of 11.6. Consider a nap, recovery activities or an earlier bedtime to make up for not getting enough sleep."

Data analysis
Another area where Whoop proves its worth, in my opinion, is the deep insight it can provide via its graphs. The way it lays out your data over time is really clear and intuitive, and so it offers an at-a-glance understanding of your data.
Take my sleep debt, for example. The below graphs show my sleep debt over the course of a week, a month, and six months, and confirms that this week's data is within my normal range. Below the graph, Whoop categorises it and shows quite unequivocally that it thinks I need more.
Another example is my heart rate variability. The graphs below show that it fluctuates quite a lot from day to day, but over time, the average stays fairly steady. From January to August 2024, it hovered between 101 and 110, sitting around 107 for the most part. But then from August through to November, it shows a clear downward trend, suggesting my body wasn't recovering correctly, and in hindsight, it's quite clear I was overtraining. I'll go into this in a little more detail below.
Journalling
The other aspect of Whoop's coaching is how it integrates daily journaling into the process.
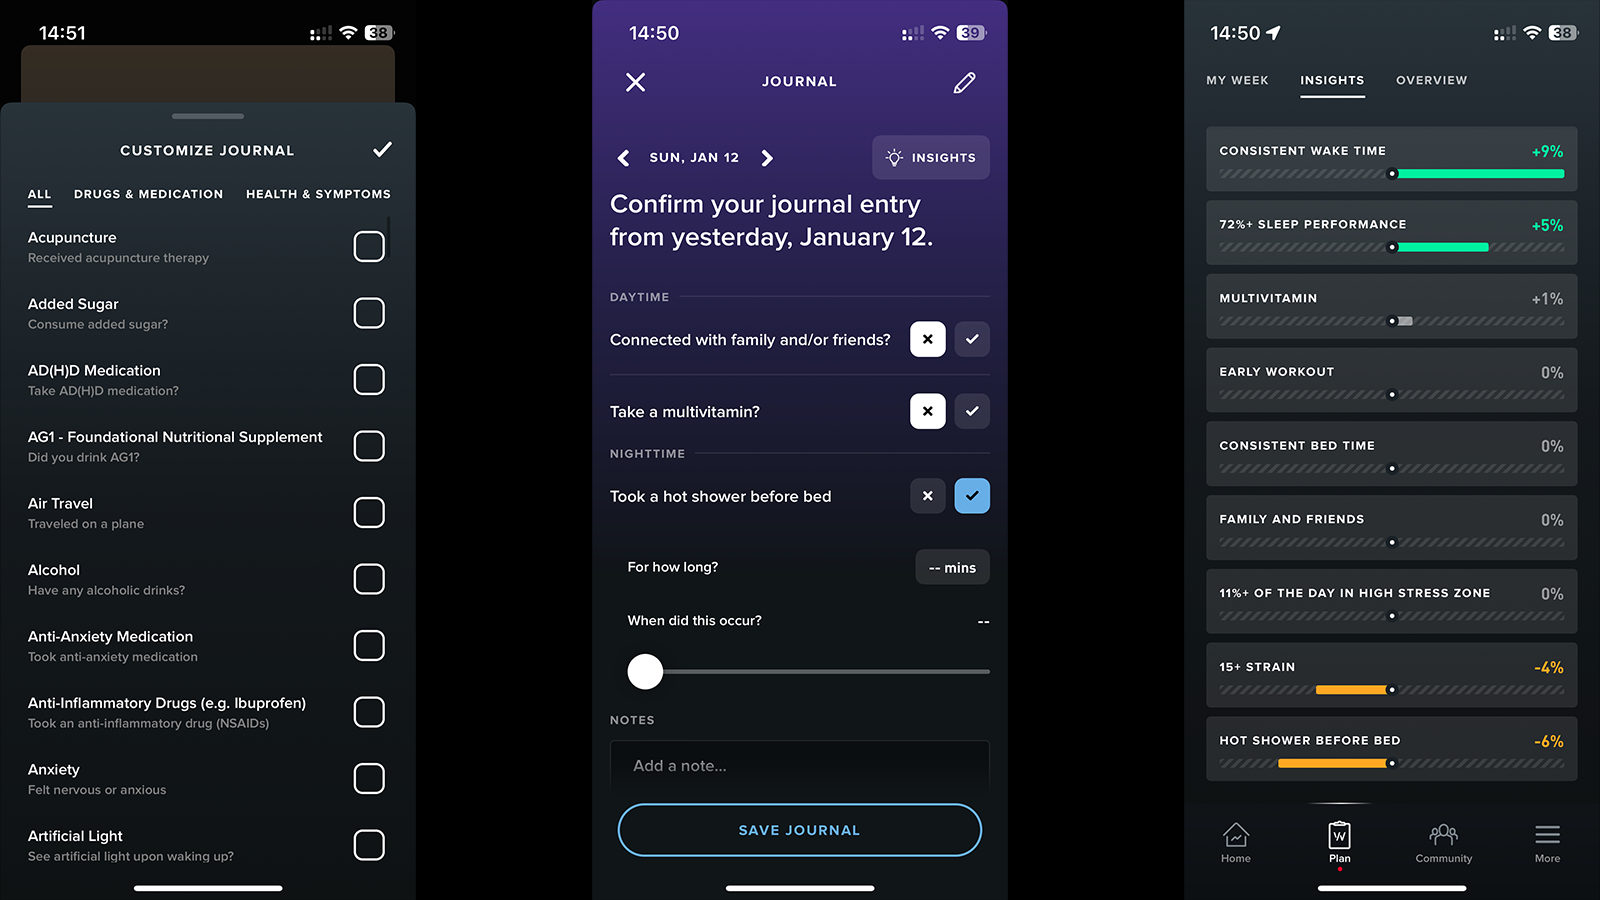
To set this up, you will initially choose a few behaviours (from a very long list of options) that you wish to track. Then each morning, a popup appears asking whether you completed your selected behaviours each day. These range from "did you take a multivitamin" to "did you work late" and "did you drink alcohol" – there are hundreds of others besides.
For a bit of fun, here are some of the more unusual behaviours you can track: Did you receive acupuncture; did you sleep with a cat (or a dog) in the bedroom; did you try to conceive a child; did you take ketamine (or marijuana, LSD or magic mushrooms); did you masturbate (or engage in sexual activity); did you experience symptoms of monkeypox; and quite simply… what is your relationship status?
Over time, as you fill in your journal each day and log your various chosen behaviours, Whoop calculates their effect on your recovery. Using its complex algorithms, it is able to pick out correlations between your behaviours and your recovery scores, and assign a impact percentage.
For example, for me, each time I've taken a multivitamin, my following day's recovery score has been on average 1% better than the days I haven't. Likewise, on the days I take a hot shower before bed, my subsequent recovery has been an average of 6% lower.
I think this fails to consider some really important context, though. If I shower before bed, it's likely because I did a particularly strenuous evening indoor ride, which probably means my day Strain is higher, and I get to bed a bit later than usual. I would predict this is the real reason for my reduced recovery, rather than the shower itself.
Similarly, Whoop thinks that working late has a positive impact on my recovery. This is because when I work late, I almost always skip my evening ride and in turn my Strain is lower and recovery is easier.
My experiences
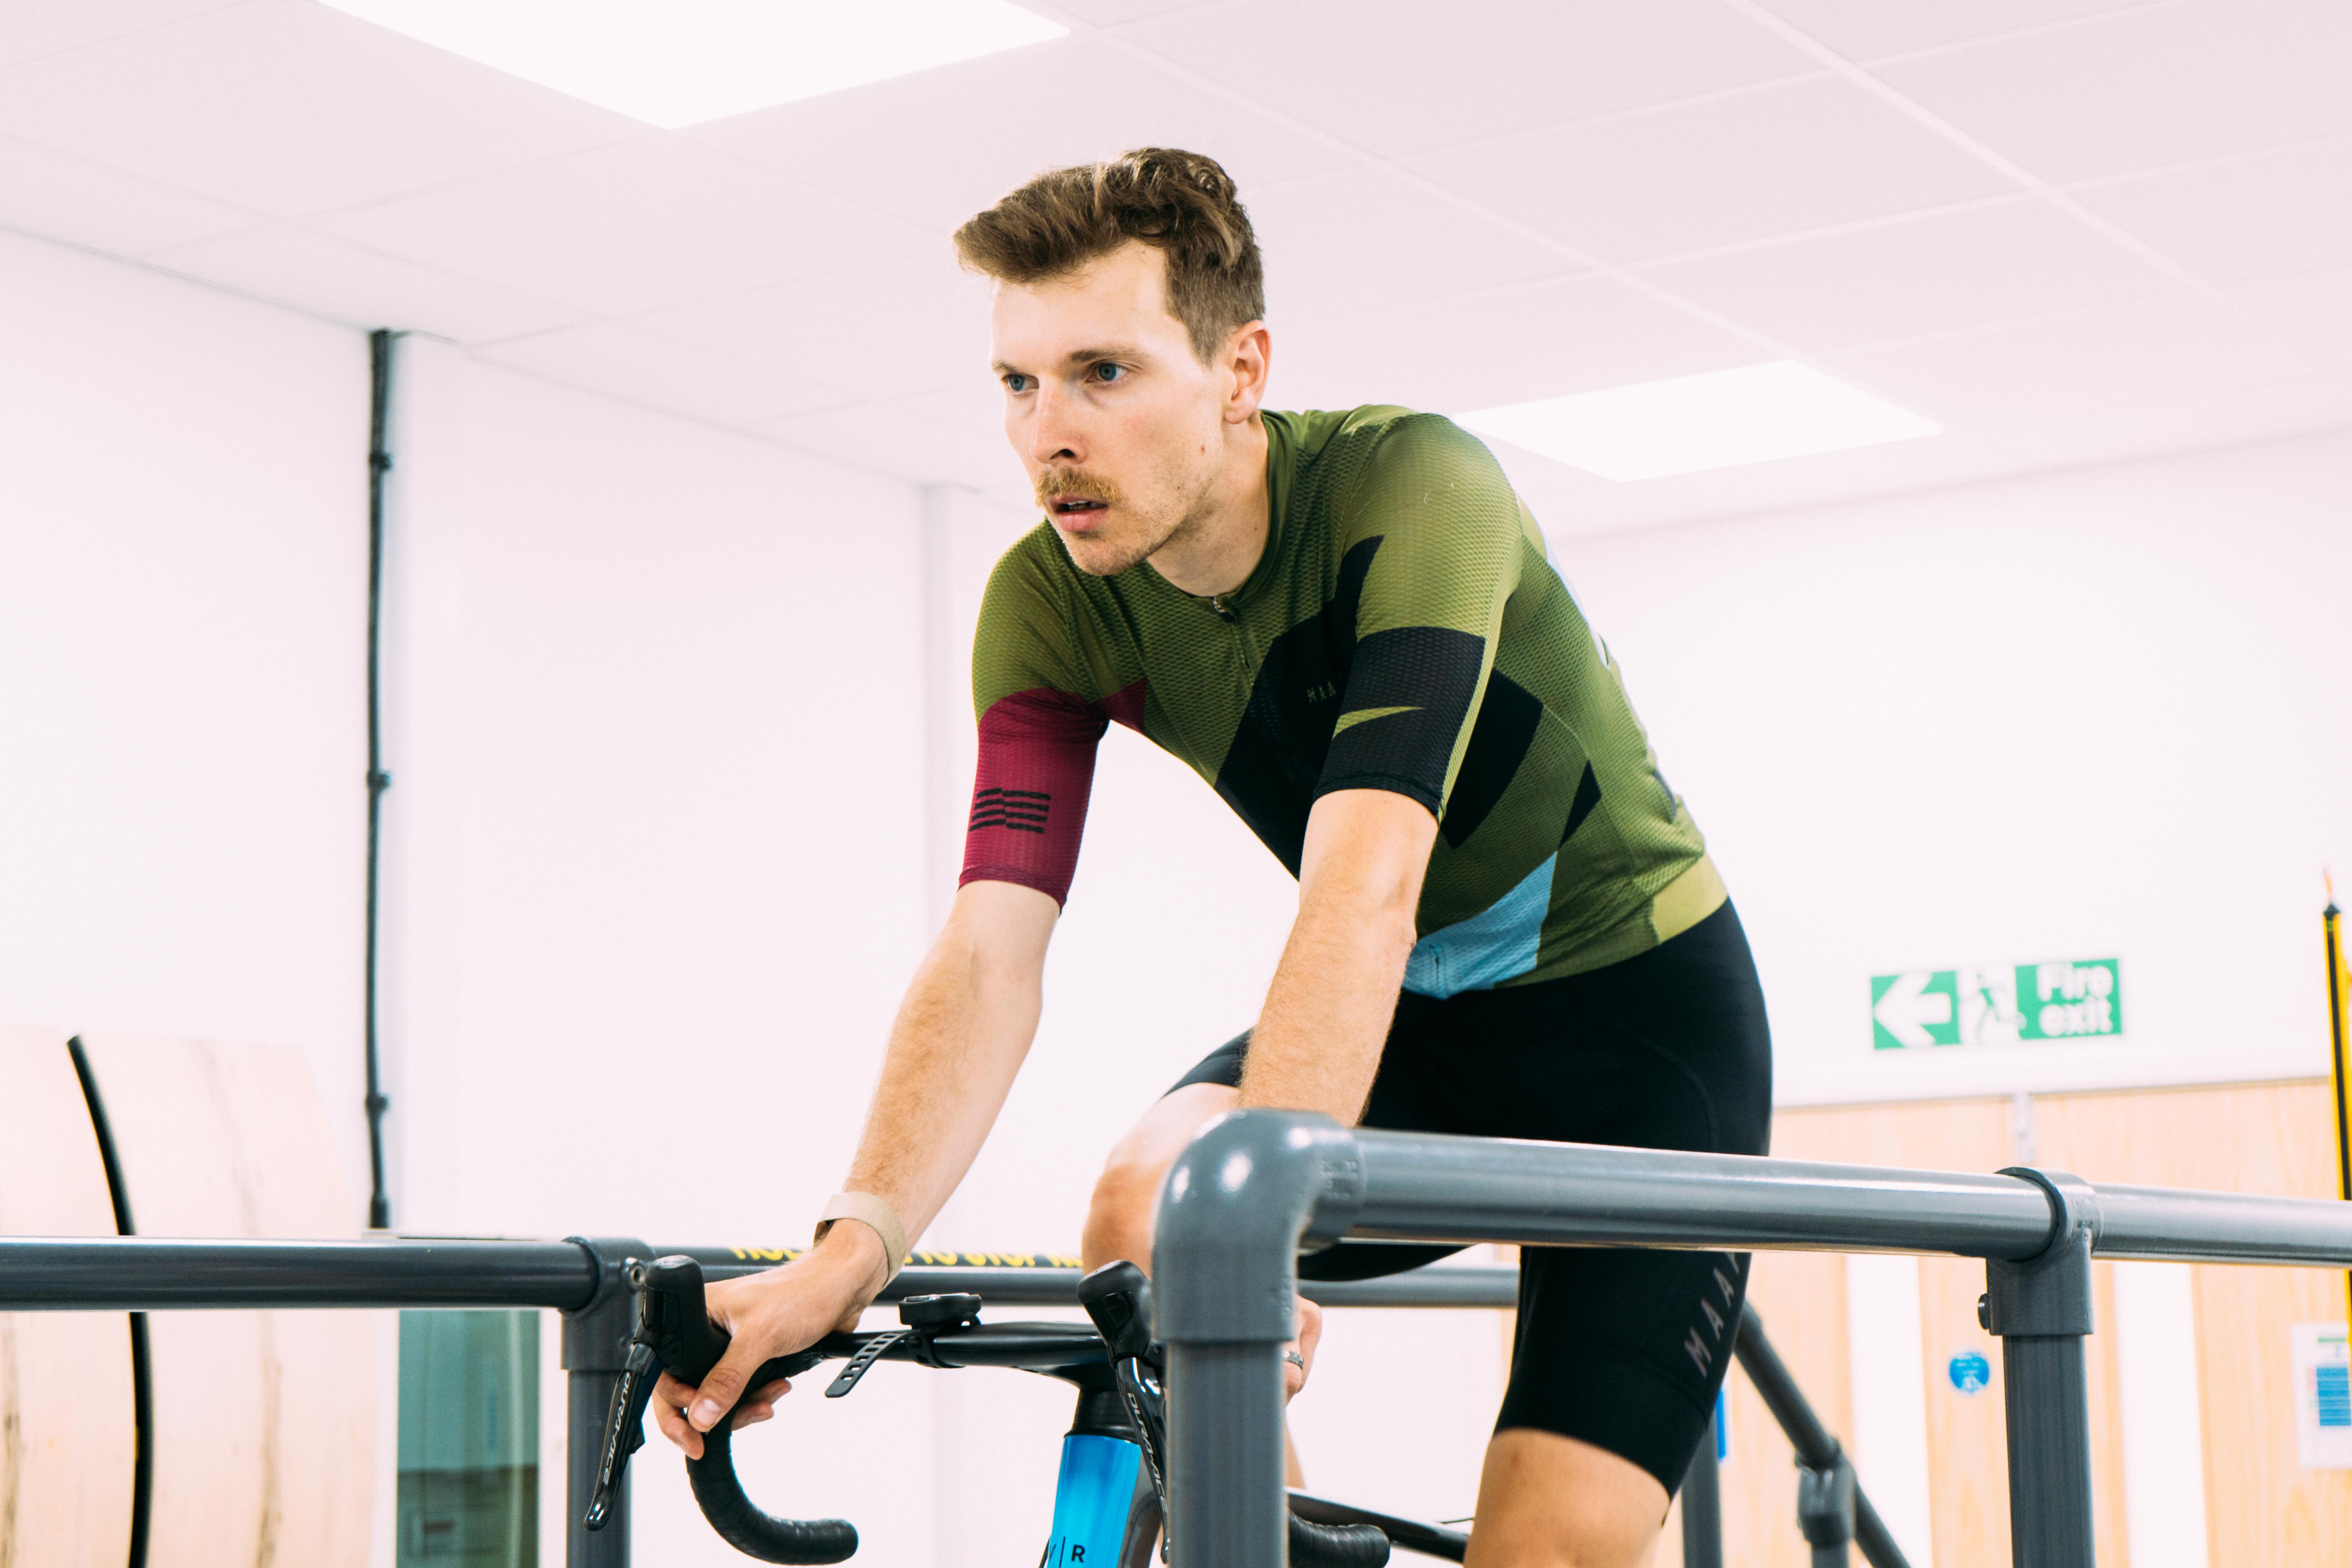
In this section, I want to get into a little more detail about my personal experiences using Whoop and the Whoop 4.0 strap. Here I'll talk about the day-to-day of wearing and living with it, covering comfort, workout heart rate accuracy and more.
I'll also dive into some of the more obvious instances of high strain or poor recovery, such as when I wore it for a 270km ride on 2 hours sleep, when I contracted Covid-19, when I joined the infamous 1% Club, and how it tracked - but failed to warn me - that I was overtraining.
Day to day
The day-to-day experience of owning a Whoop 4.0 is seamless. As I mentioned above, it automatically notices when you go to bed and wake up, and it does the same for workouts so there's no need to remember to input your workouts or log anything. Daily journal aside, which you can ignore, it needs no input whatsoever besides remembering to charge it.
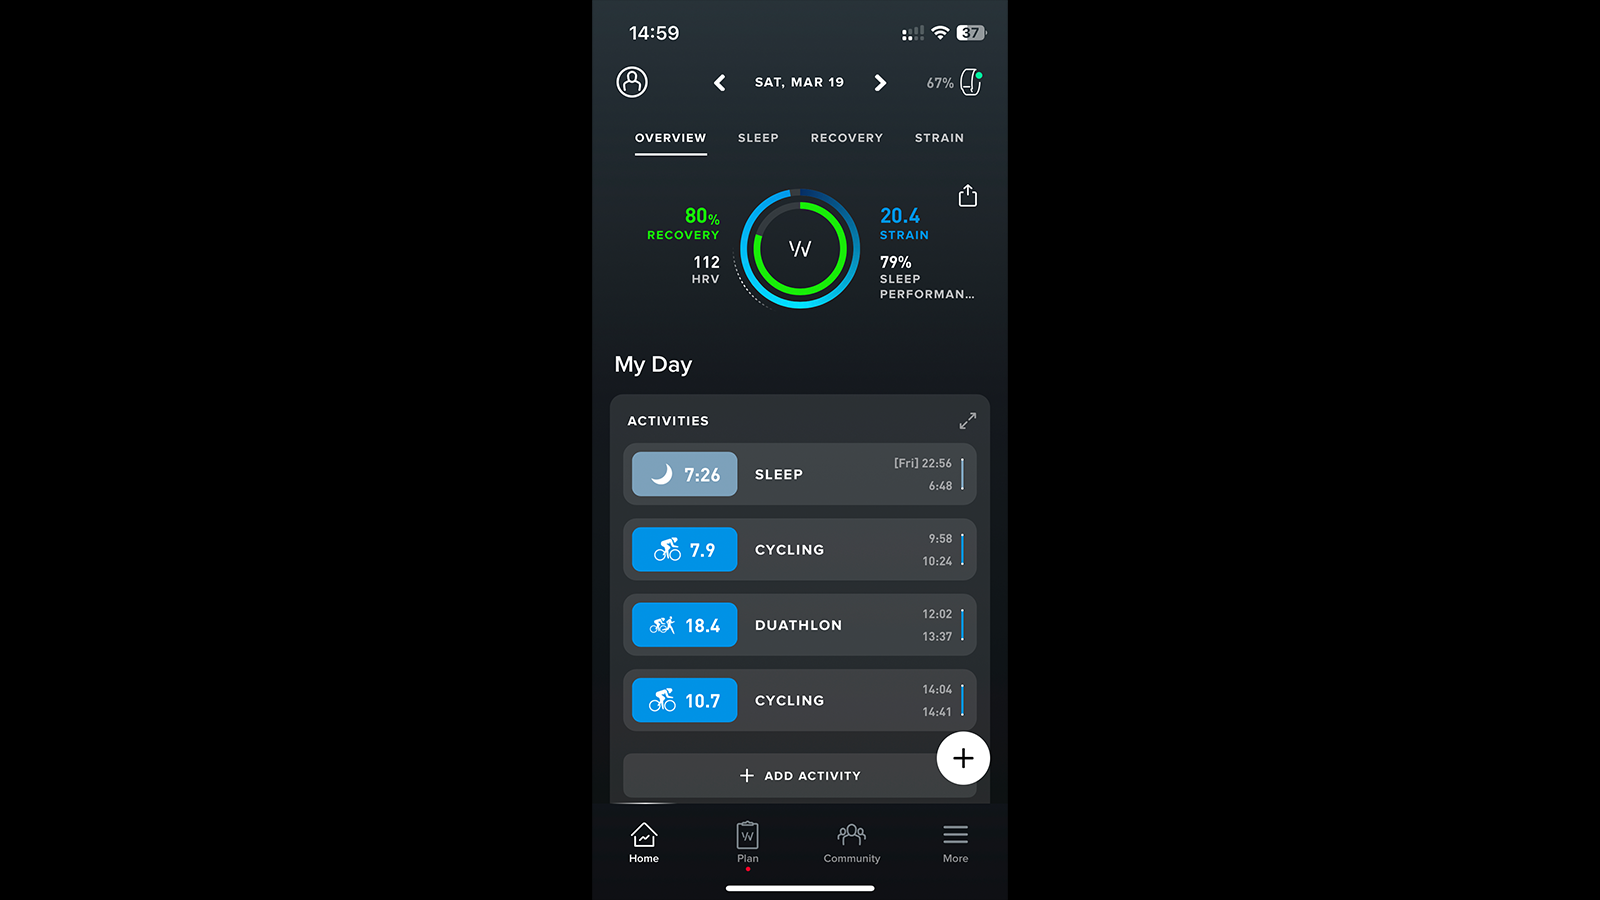
It's really clever at knowing what type of workout you did too, to the point where it can even work out the difference between a 'Spin' and a 'Cycling', or as in the image above, a 'Duathlon' and a 'Cycling' (I rode to and from the event). At first, it will get things mixed up, but after around a week of correcting the errors, it learns.
It's largely comfortable, but I will say that given you need to wear it tight enough that it sits snugly against your arm, it can sometimes cause irritation, redness, and soreness. This is especially prevalent in warm conditions, presumably a result of sweat build-up or expansion/inflammation.
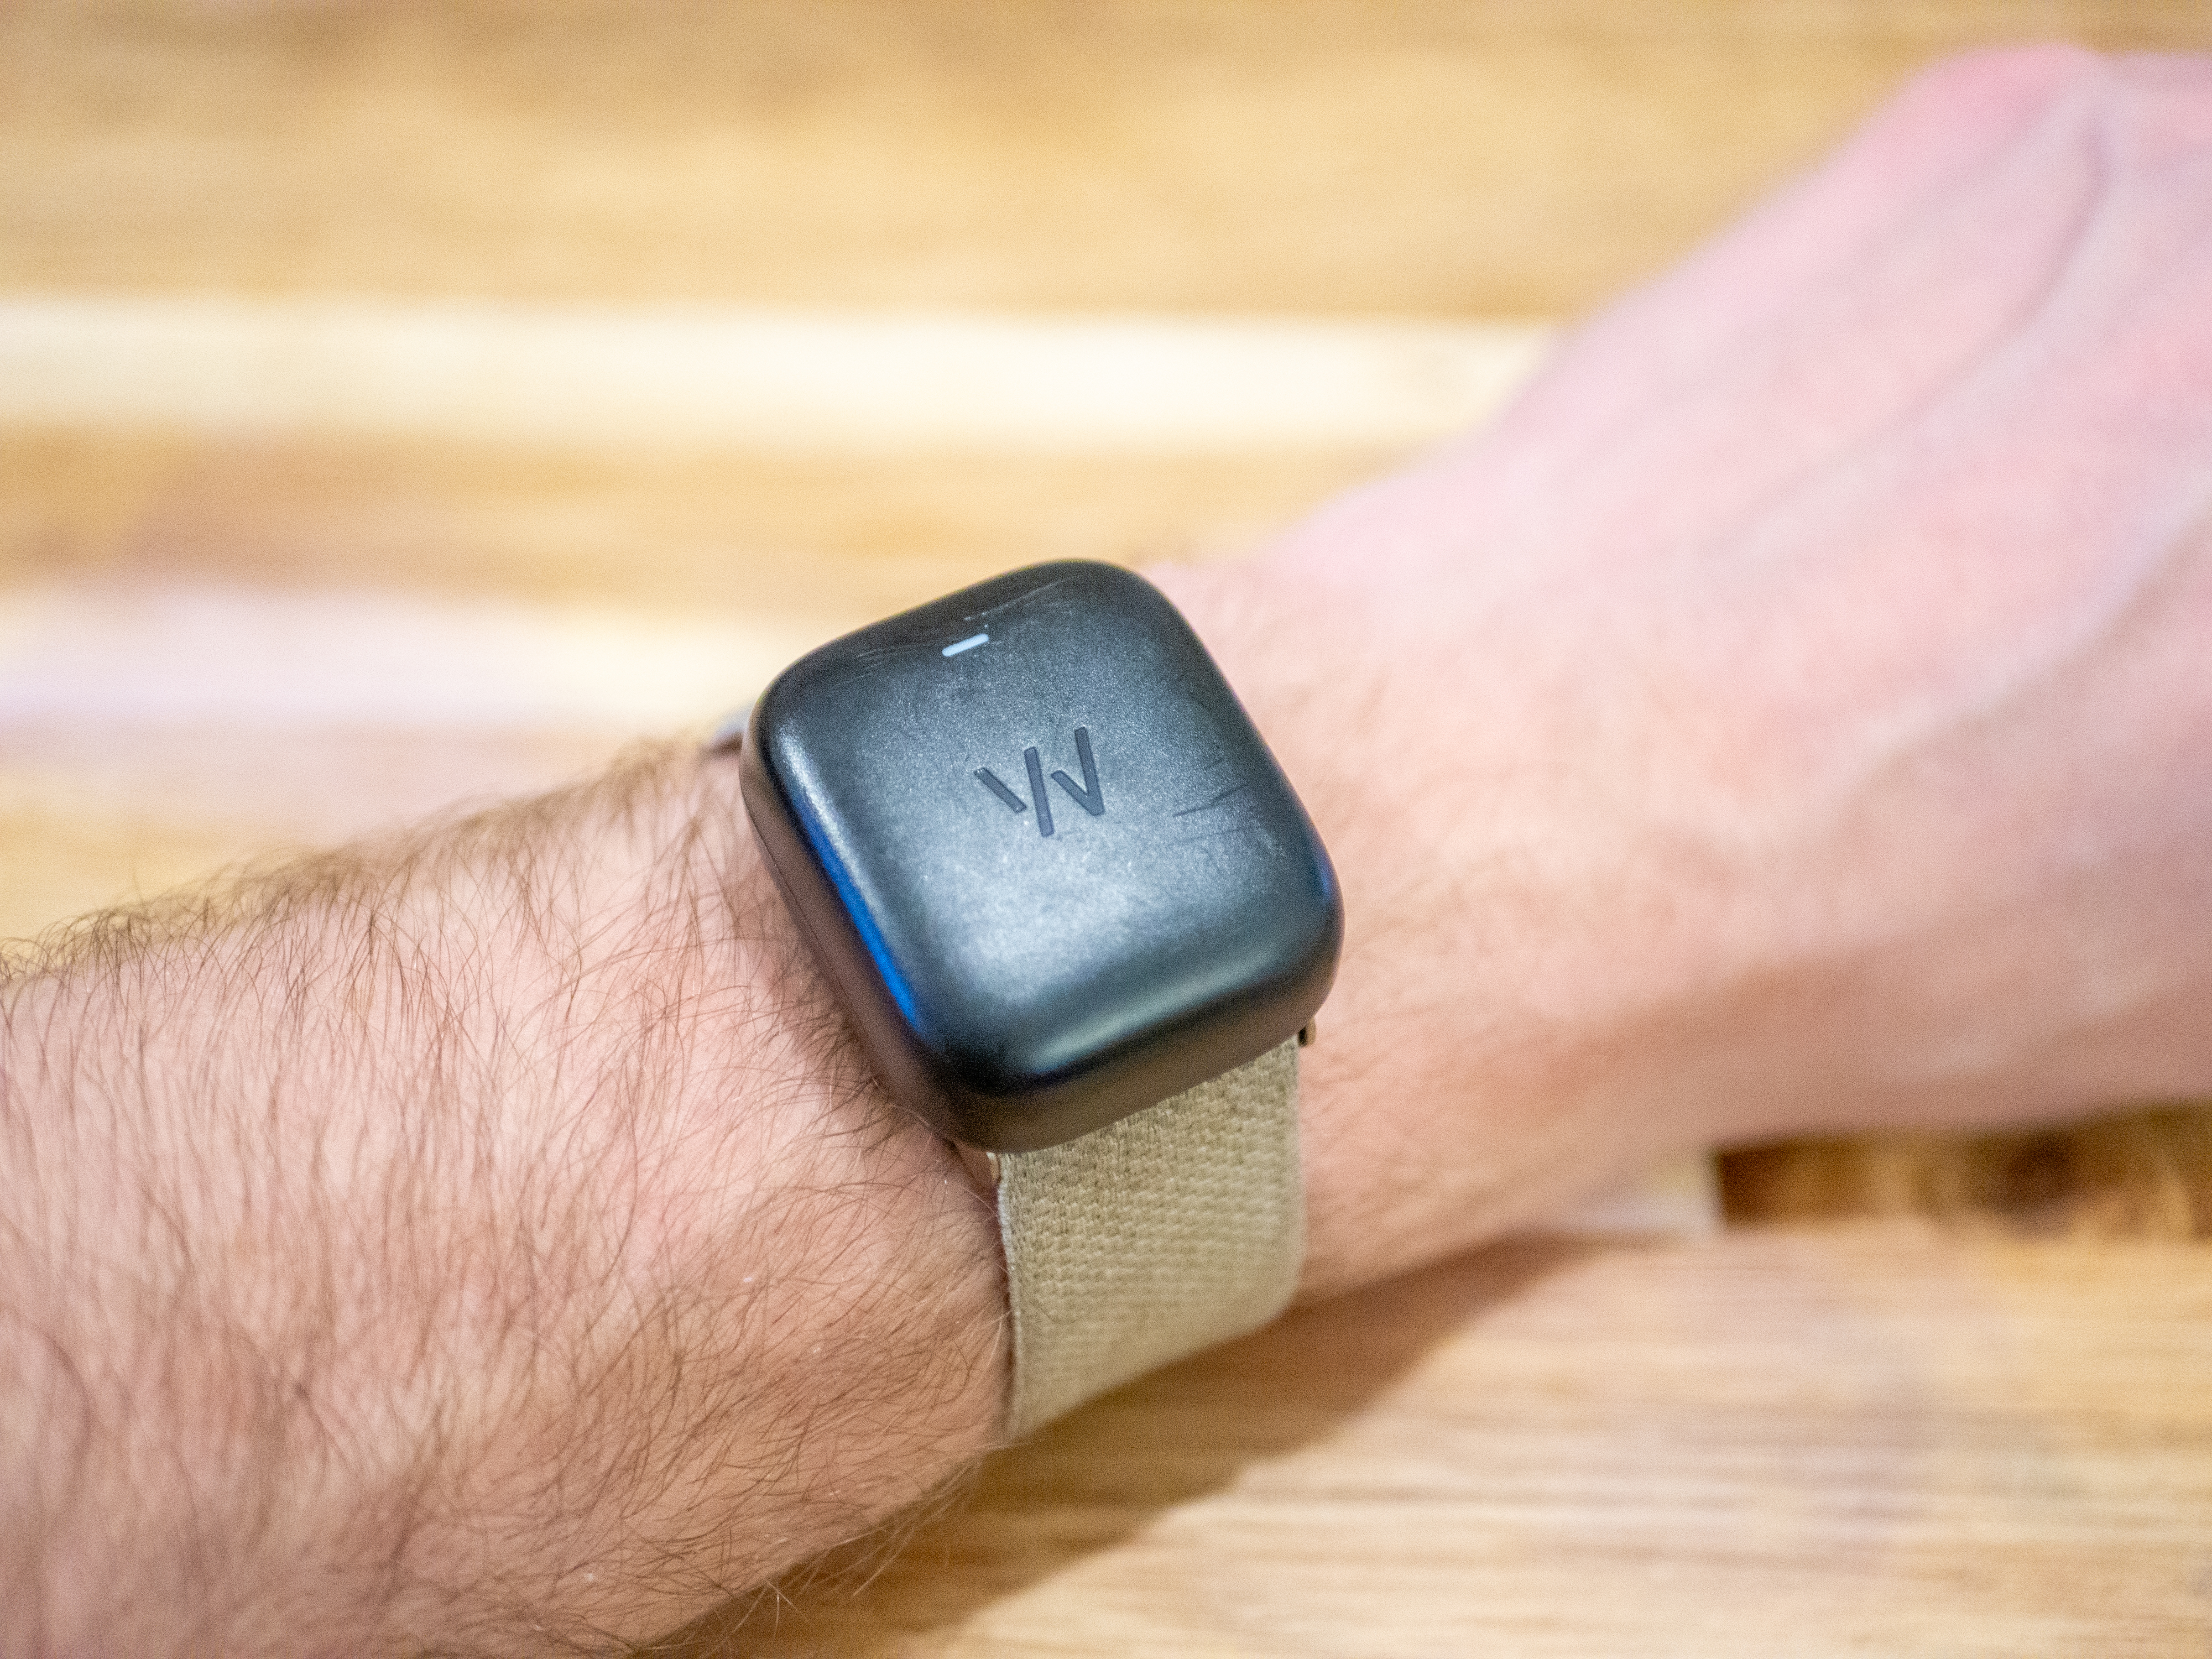
As mentioned, charging is done on the wrist via a clever piggyback wireless charger that clips onto the sensor. The charger itself is charged via USB-C, and carries enough for one charge of the Whoop itself. That then lasts somewhere in the region of 5 days, and after this point, I often realise I forgot to charge the charger! My idiocy aside, the whole process is really clever and easy.
Heart rate accuracy
I've been wearing the Whoop 4.0 since it launched, and in that time, I've probably ridden my bike close to a thousand times, each time using a chest-based heart rate monitor alongside the Whoop strap.
I have also occasionally used the 'heart rate broadcast' function, which allows third party devices (bike computers, laptops etc) to use the heart rate data from the Whoop itself.
Here are a couple of examples of the Whoop heart rate data in workout compared to a chest-based heart rate monitor.
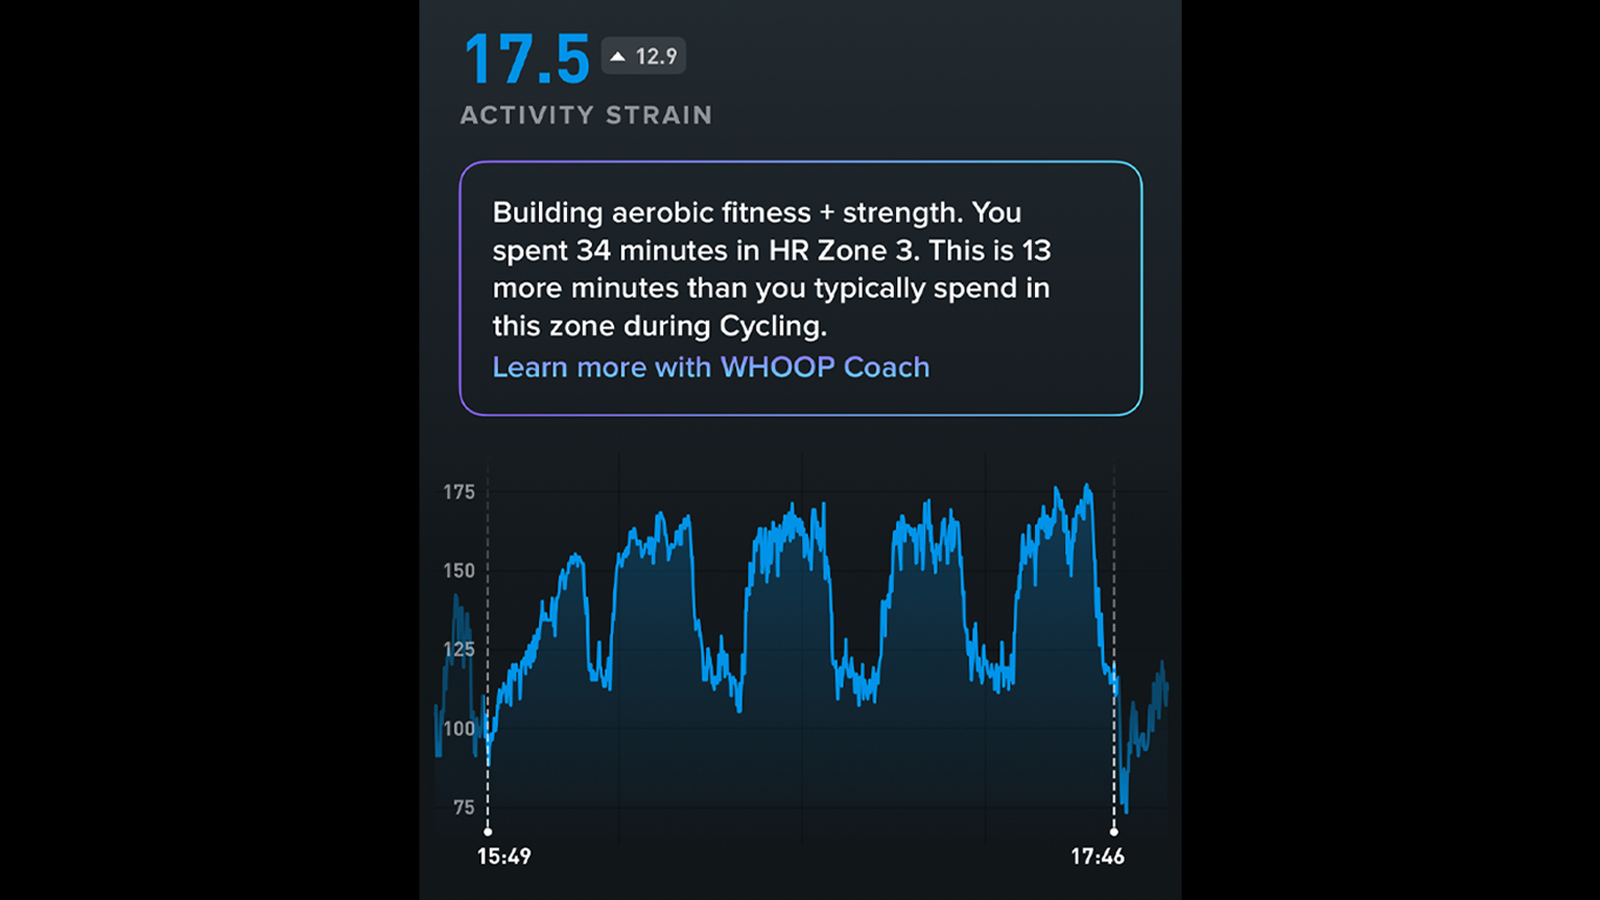
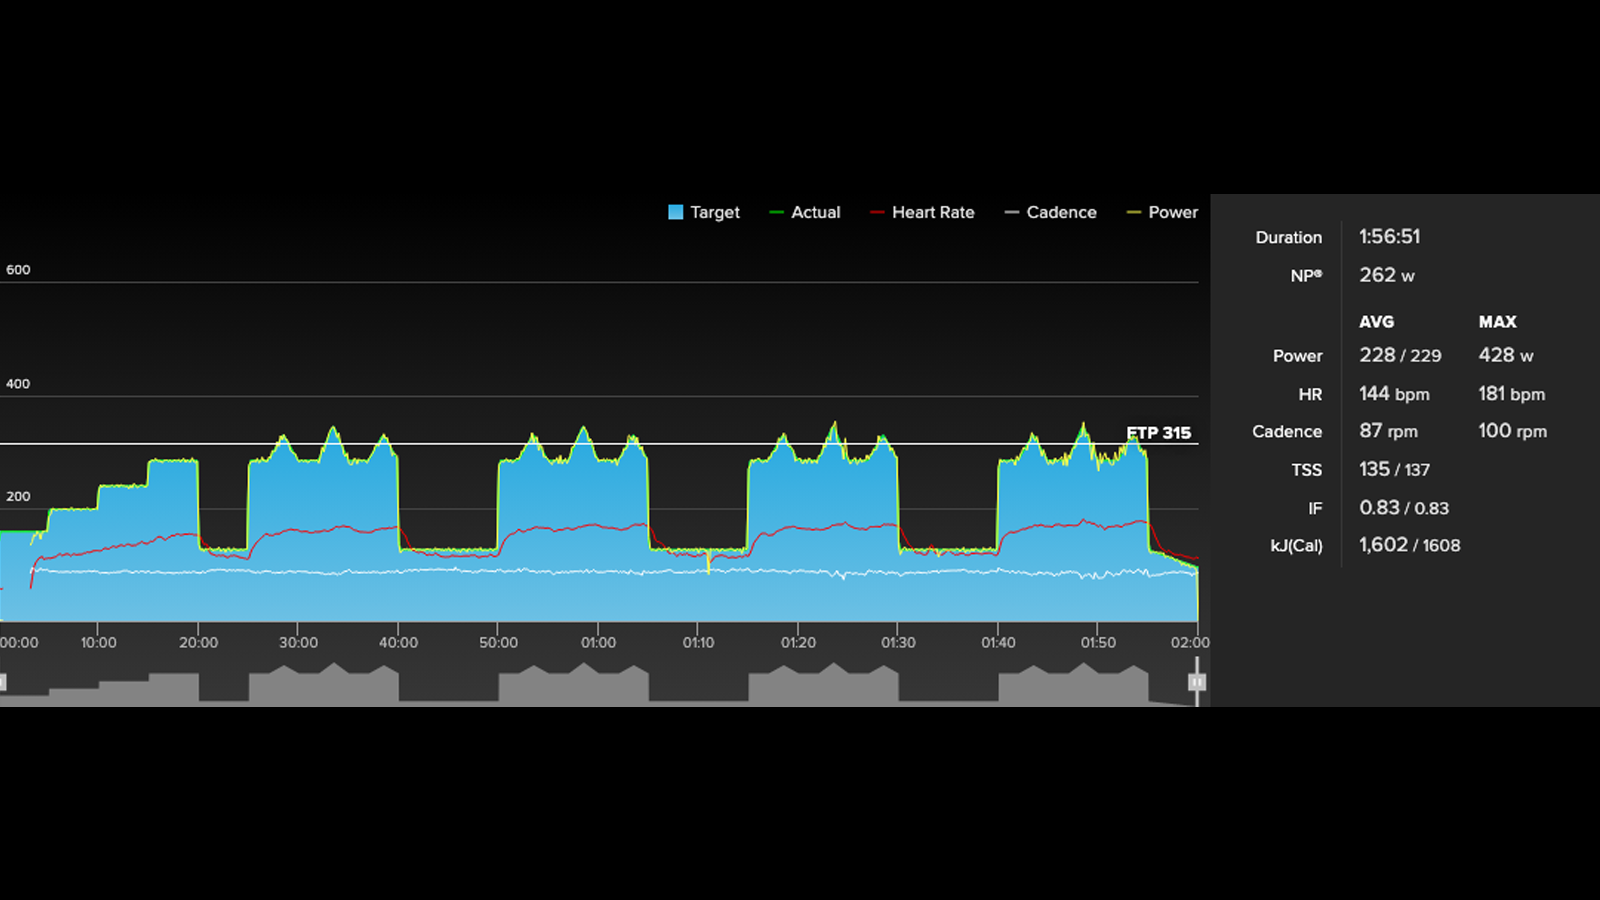
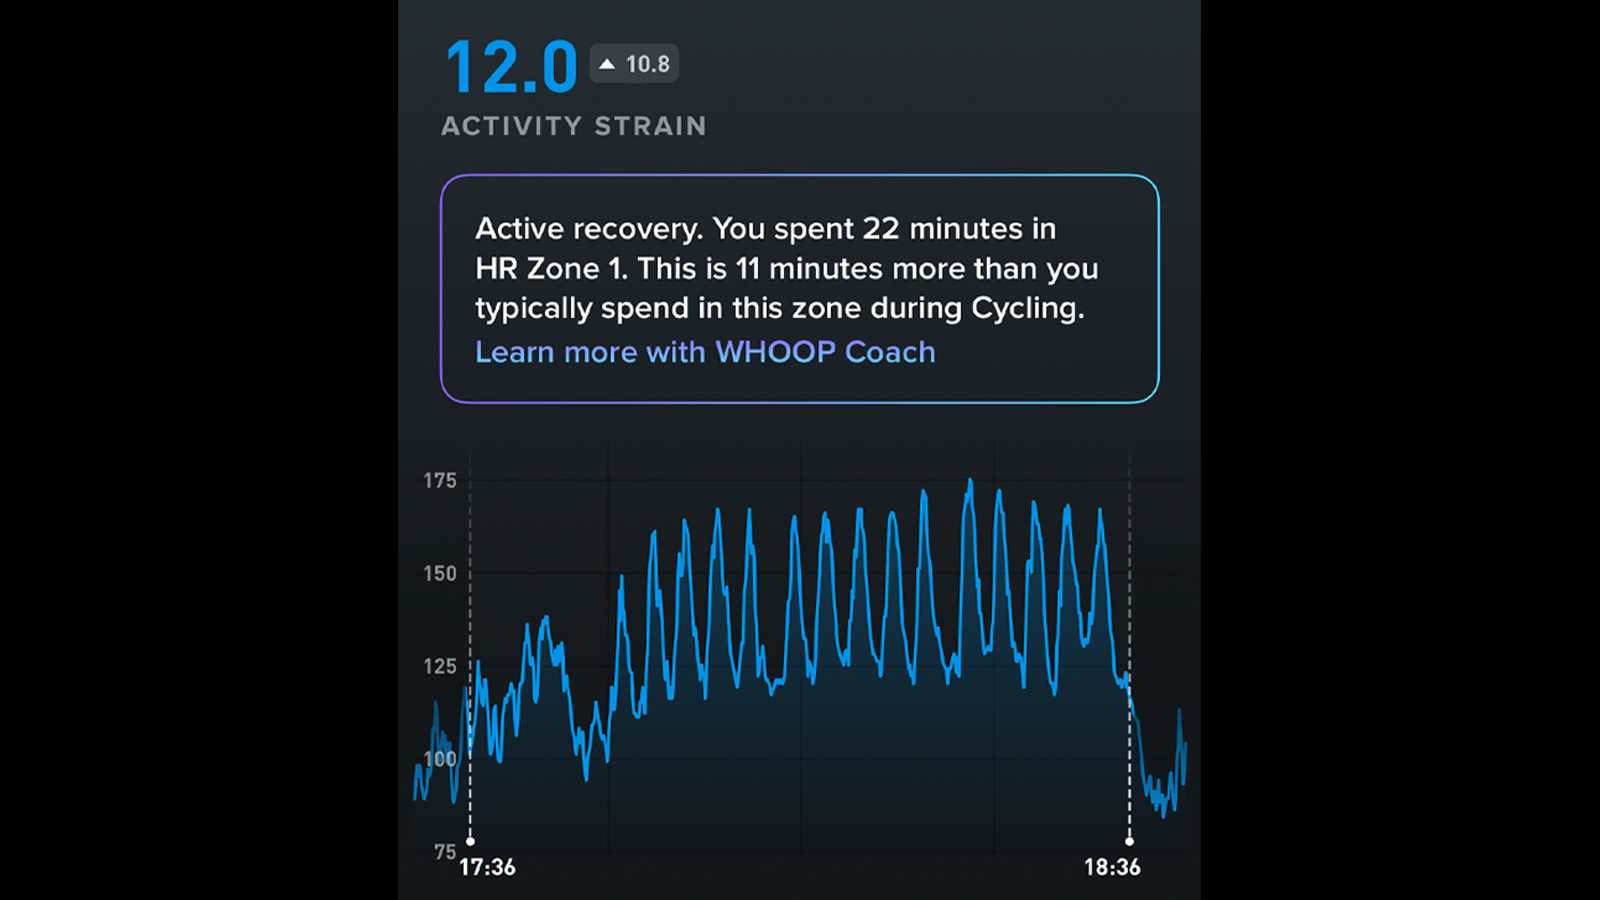
Here, I completed an over-under Threshold workout on TrainerRoad. According to the Garmin HRM Dual I used, I averaged 144bpm, with a max of 181. The corresponding Whoop heart rate graph follows a similar graph, with a slightly lower average of 139bpm, maxing out at 177.
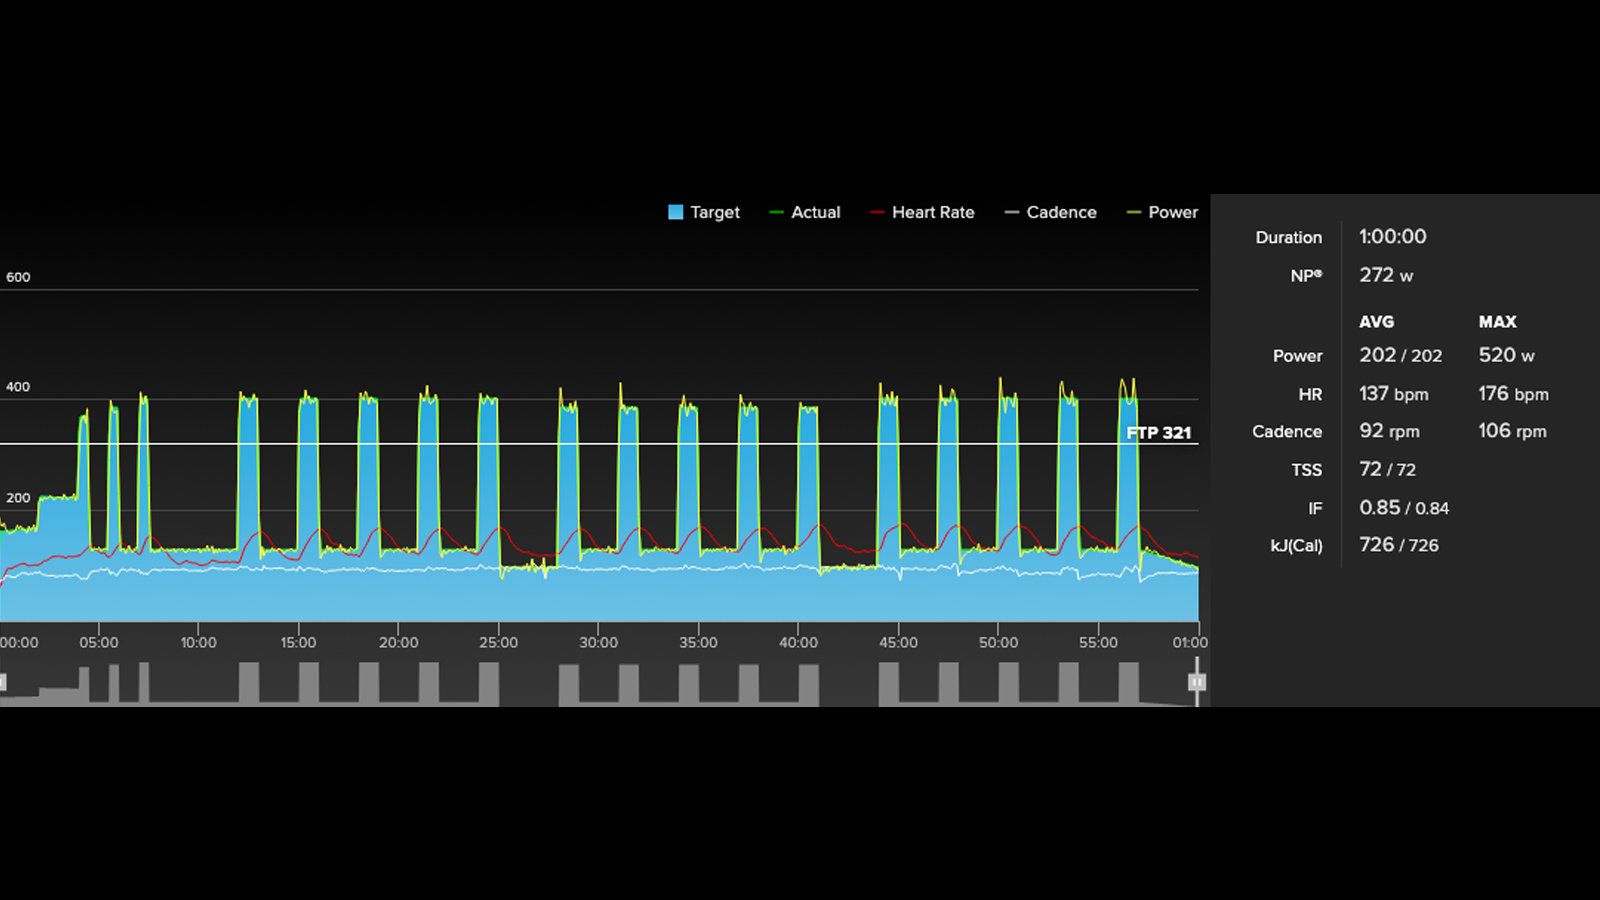
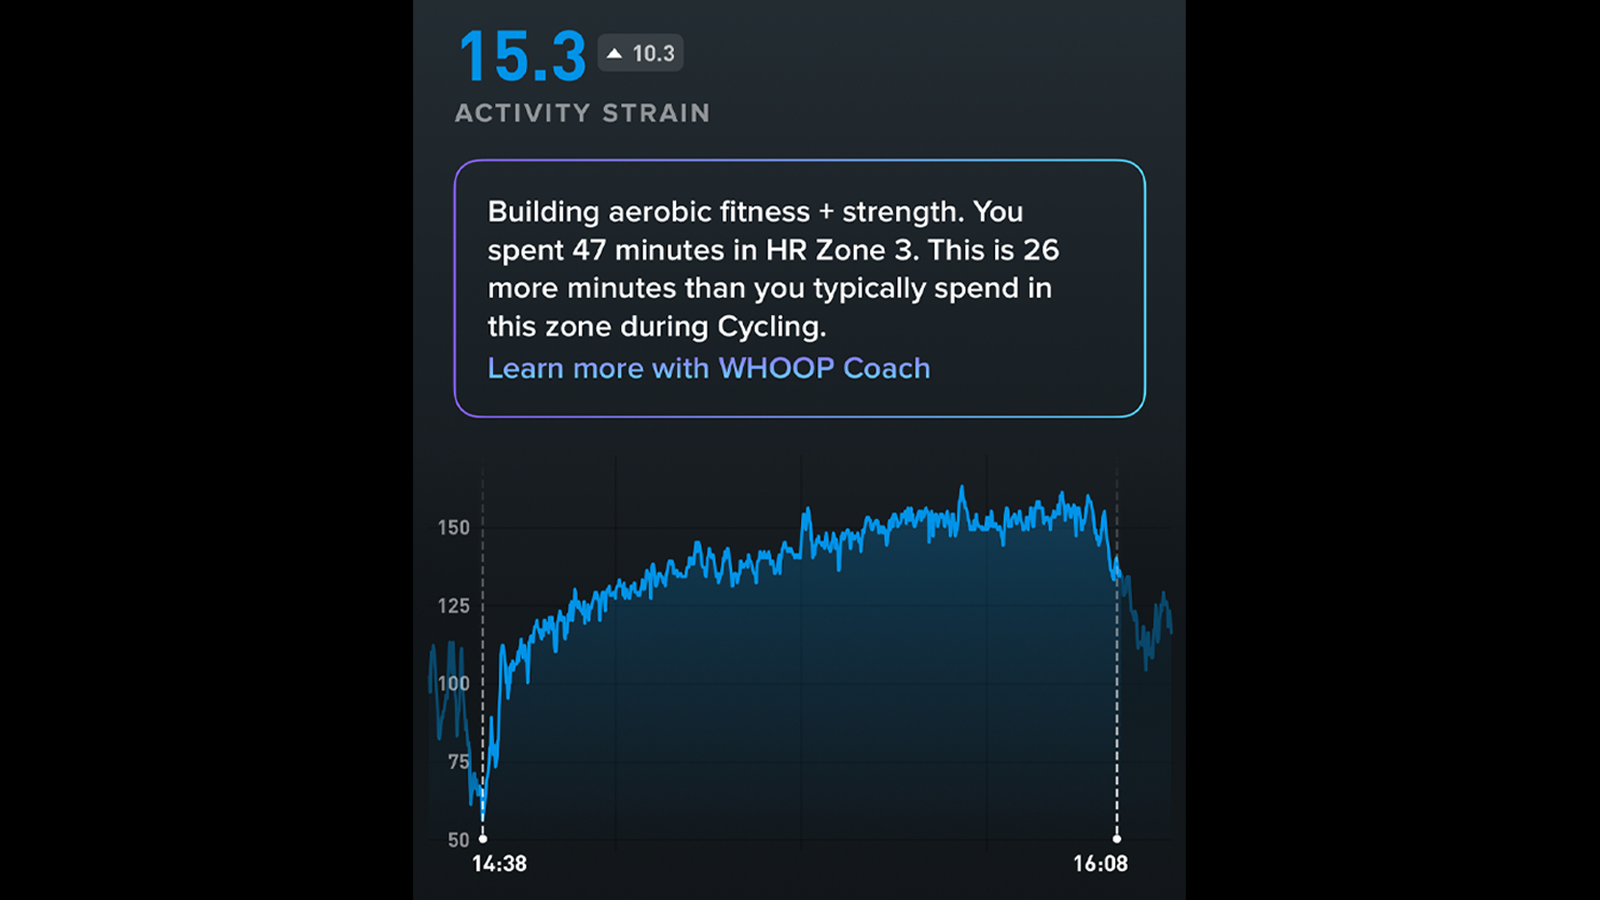
Here, in more of an on-off Vo2 Max workout, my Wahoo Trackr showed an average of 137bpm, with a max of 176. Again, the Whoop data follows a similar graph, proving the Whoop 4.0 is capable of noticing quick changes in heart rate. My average here is once again lower, at 128bpm, but the maximum of 175 is very close.
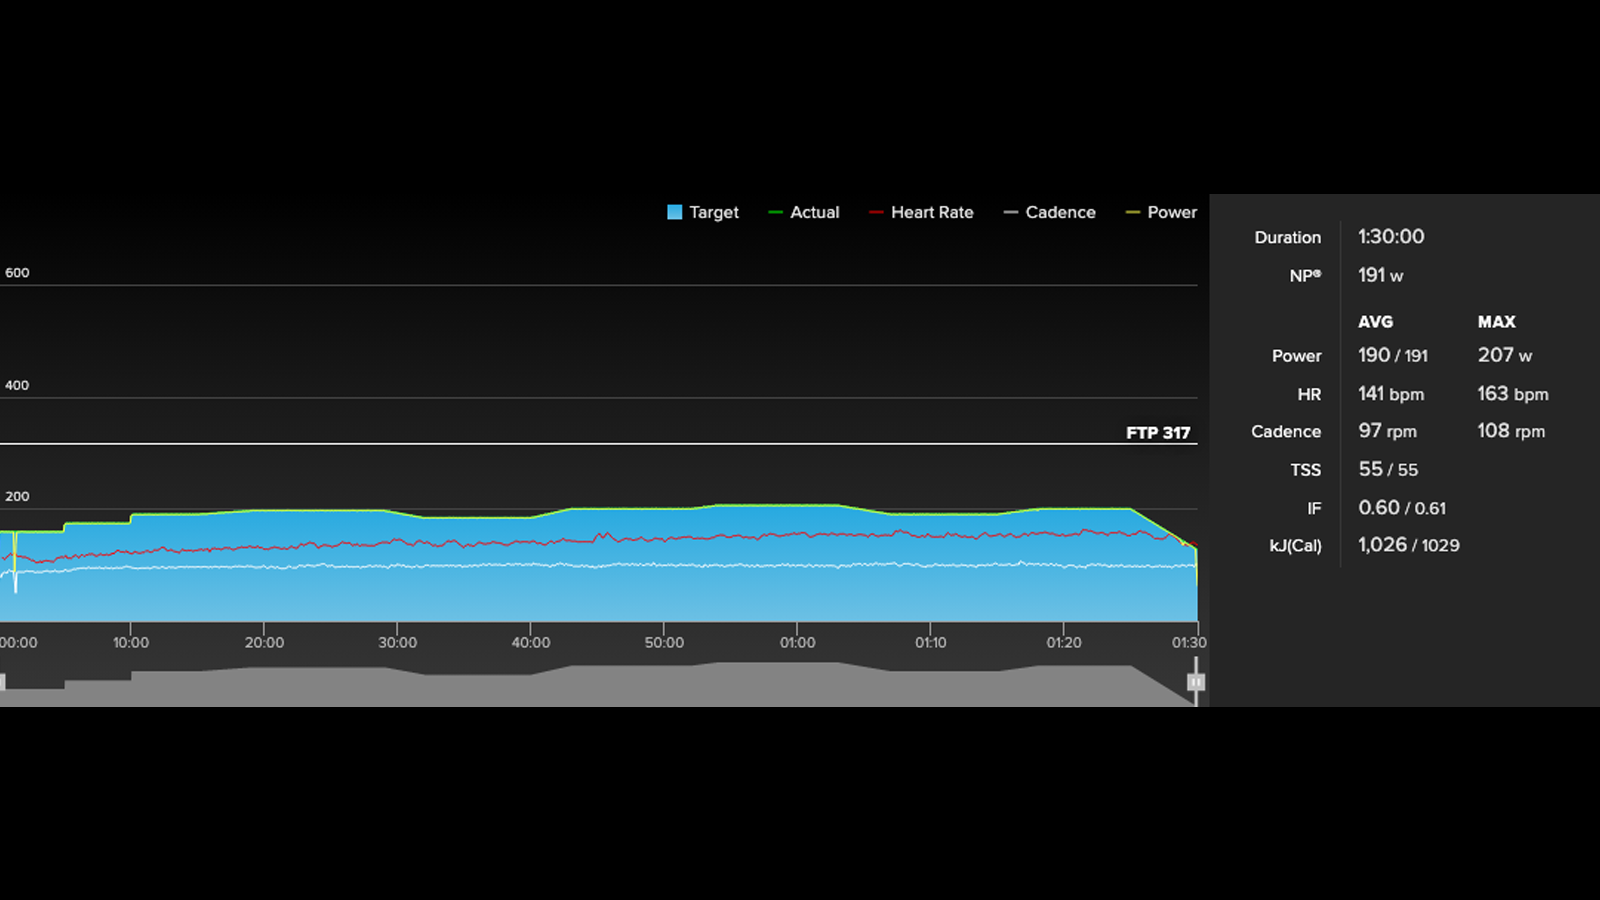
Choosing an easier ride – both for me and for the heart rate sensors – this 90-minute endurance ride from July had my heart at 141bpm average, maxxing out at 163. Whoop's data once again followed the same graph, in this case a gradual increase. It averaged slightly lower at 137bpm, and in this case, peaked at the very same 163.
It's a similar trend throughout all workouts, both recent and historical. The average tends to be slightly lower than chest-based monitors, but the highs are captured correctly, as are the changes.


Sleep accuracy
The accuracy of its sleep tracking is another thing Whoop does really well, although not without a couple of caveats.
I've worn the Whoop alongside Garmin, Apple and Polar watches. I've never worn all four at once, but while time in bed is largely accurate across all devices, I found my HRV figure varied from device to device (presumably based on when in the night it gets measured).
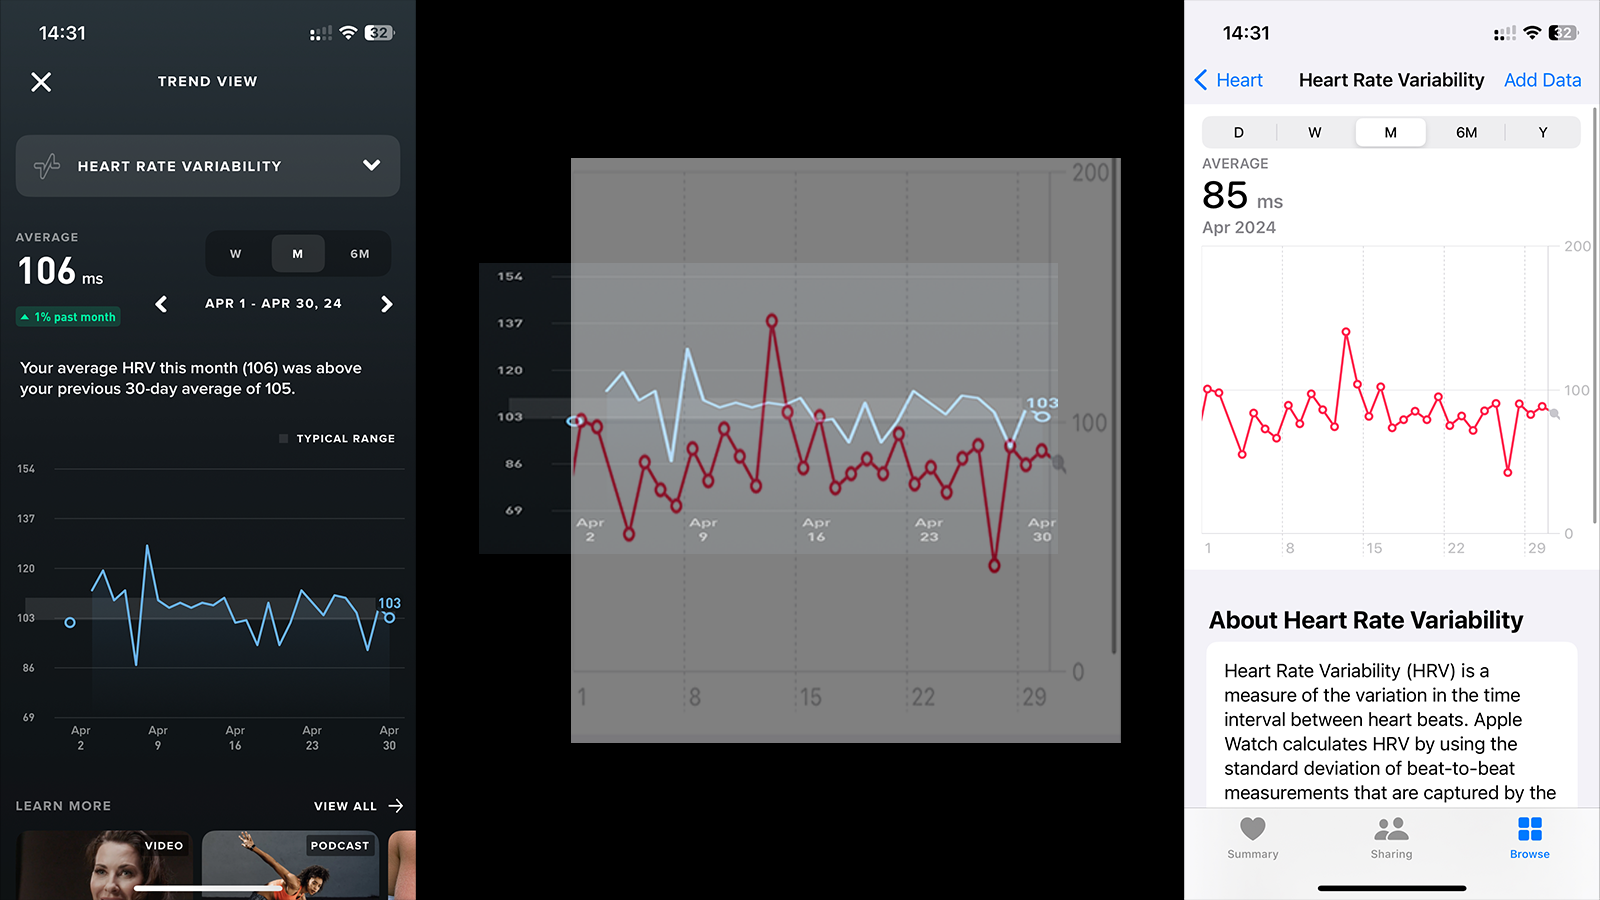
An example of this can be seen in the two graphs above. Here I wore both the Apple Watch Ultra 2 and the Whoop 4.0 together (on separate wrists) for a month. According to Apple Health, my HRV averaged 85 milliseconds, while on Whoop, it was 106. I don't think the accuracy is actually all that important as much as the consistency. As long as you stick to one device, the data should be useful. Flit between devices and your data will be equally erratic… like doing an FTP test with one power meter and training with another. Or weighing yourself at different times of day.
The sleep stages (Deep, REM and so on) are varied even more so across devices, and with that, I tend not to worry about how much time I spend in each. It's not something I can easily control anyway.
But as for what time I got into bed, what time I nodded off, and what time I woke up, I found Whoop's estimate was most consistently accurate. If you already own one of those watches, the difference alone isn't worth the extra $30 a month, but if you're coming at this problem fresh, this is a selling point in favour of Whoop for sure.
COVID-19 in Whoop terms
In August 2022, I was invited to Switzerland to ride Chasing Cancellara, a 270km sportive from Zurich to Zermatt. It was a brutal day, made significantly more unpleasant by the 02:00AM start.
The night before, I went to bed at 8pm, lay awake for around two hours (damn you, circadian rhythm) and eventually fell asleep at 22:39 (so says Whoop). My alarm sounded at 00:30, and Whoop reckons within this time, I managed 1 hour and 44 minutes of sleep. My recovery score was 7%.
Up and in kit, I headed over to the nearby start, before riding for 13 hours, finishing at around 3PM. My biggest ever day was good for a 20.7 on the Strain scale. But the next night's sleep was no better. A late bus from Zermatt back to Zurich meant I didn't get back to my hotel until 11pm, and the following day I was up at 6am for an early flight home. Despite a comparable eon – four whole hours – of sleep, my previous day's strain meant my recovery was just 4%.
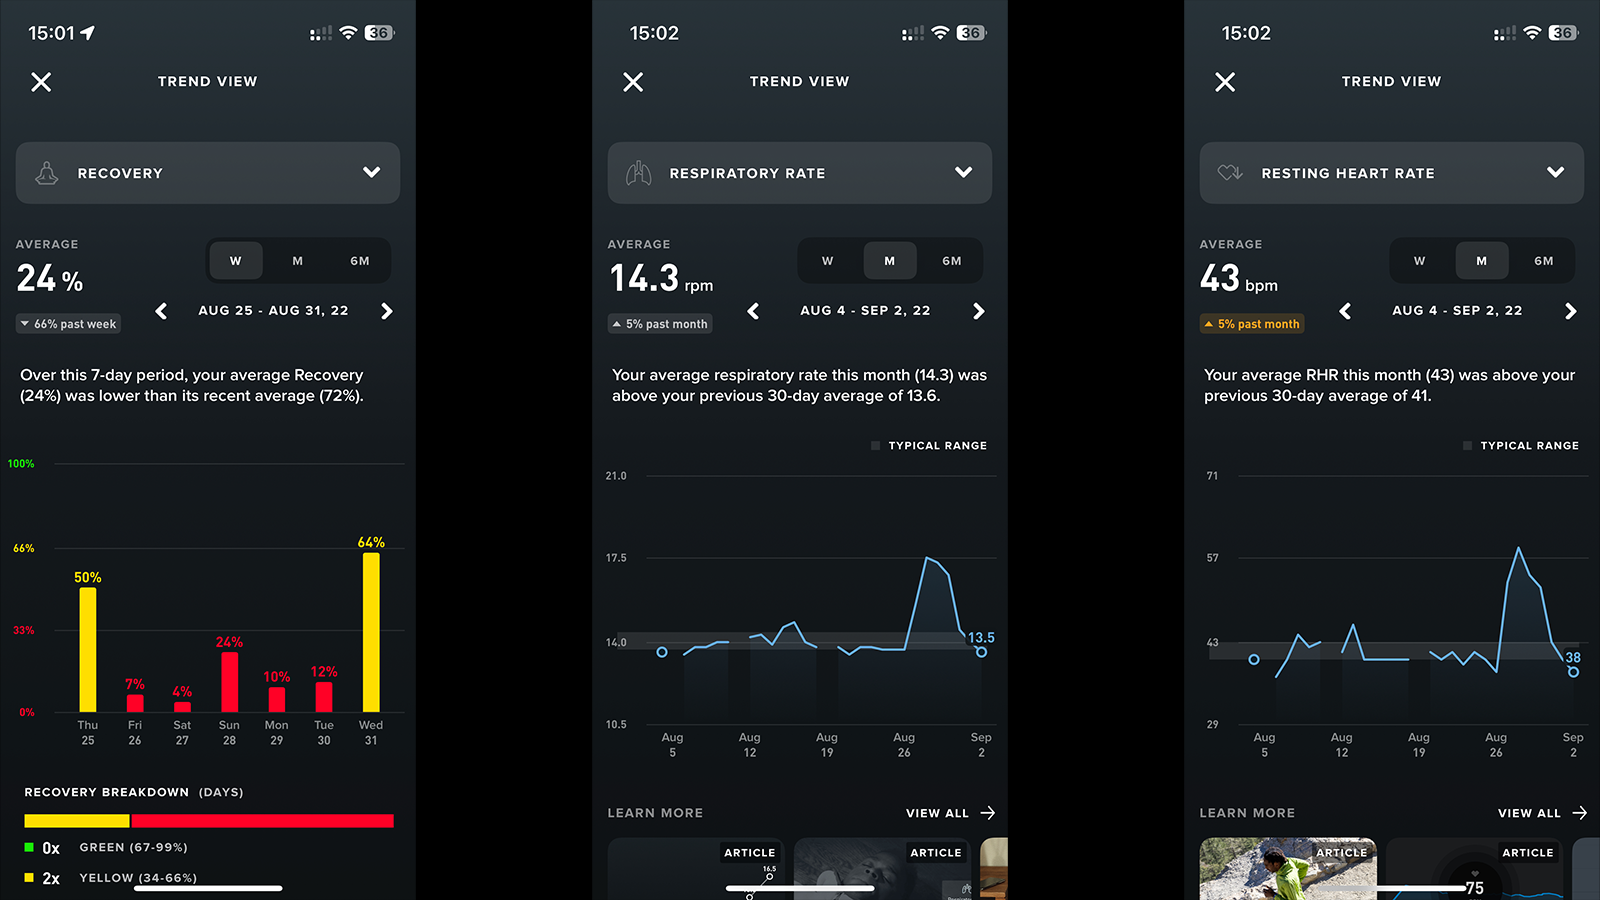
The next day, I managed an hour-long nap before a seven-hour sleep, and though my recovery was improving, it had only jumped to 24%.
I then began to feel ill. A positive COVID test confirmed the worst, and despite doing absolutely nothing for two days, my next two recovery scores were 10% and 12% respectively.
Interestingly, during these days, my resting heart rate rose from around 40 to the mid-50s. My HRV dropped from the usual ~110 to the 60s. My respiratory rate shot from a consistent 13.6rpm to 17.5. And despite spending the day in bed, I managed to hit a Strain of 13.5 on the Tuesday.
The 1% club! Whoop vs lots of alchohol
But that wasn't my worst recovery ever. I am a proud (ish) member of the infamous 1% Club - that is, hitting a recovery score of 1%.
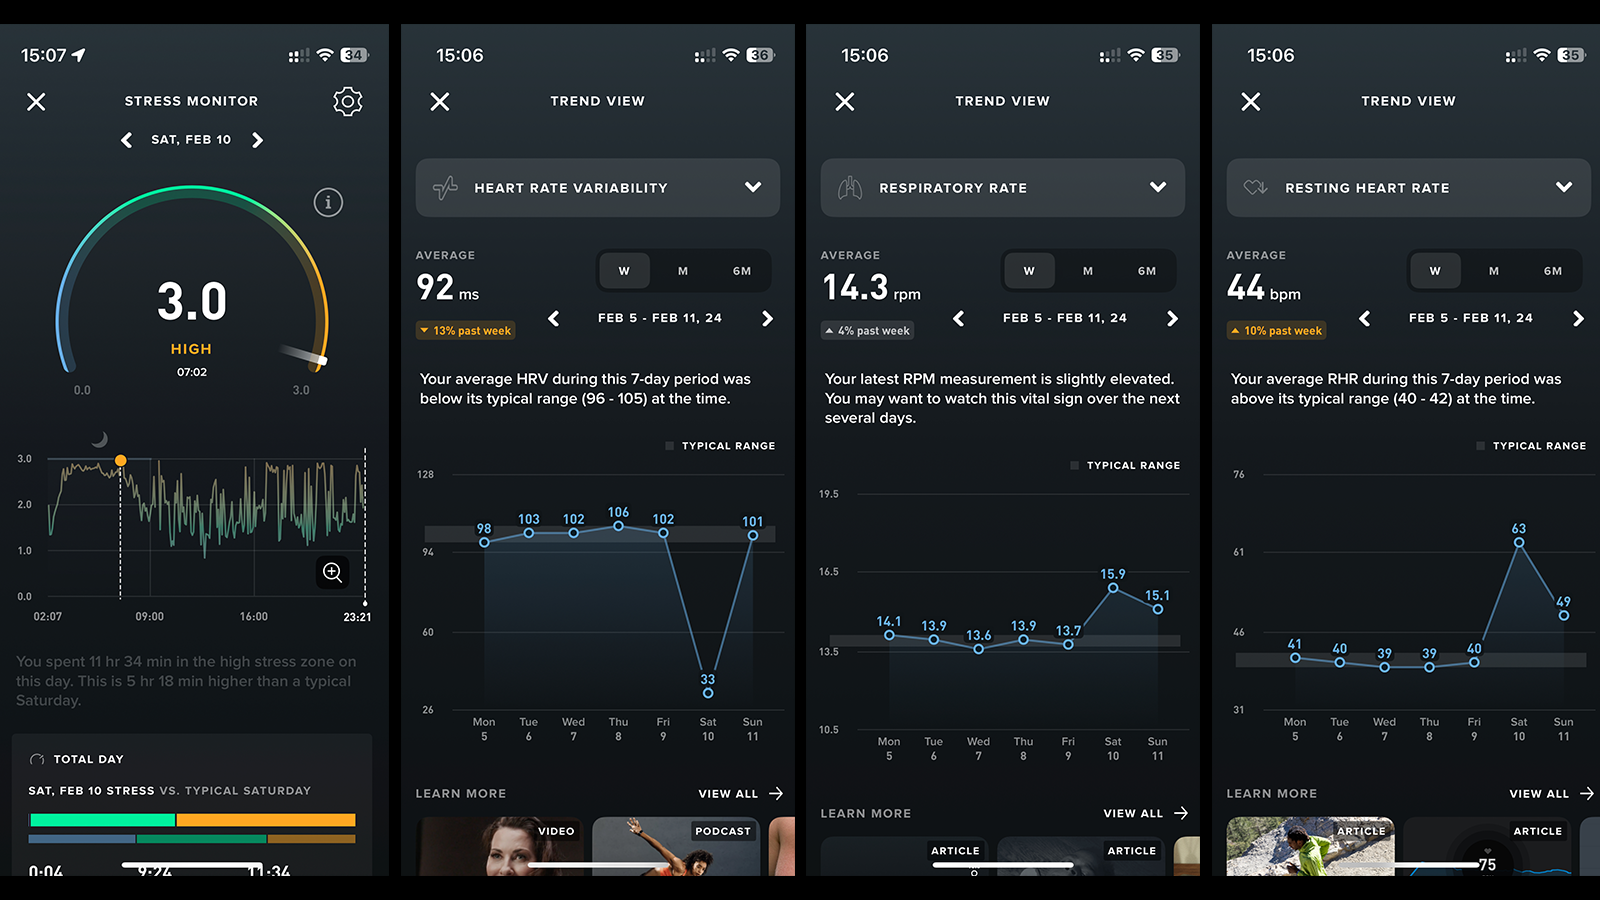
I don't drink a lot, even less so now I can see what effect it has on my body, but I got married in 2024 and so in February, it was my stag do (bachelor's party for those in the USA). The first night of said stag do was a boozy one.
The most interesting part, however, is the 'stress' I accrued while asleep. In the five hours of sleep I managed, it was almost entirely spent in the high stress zone (a measure of motion, HRV and heart rate). My respiratory rate shot up to 15.9rpm, my resting heart rate jumped to 63, and my HRV dropped to 33 – that's worse than when I had Covid!
I appreciate that tales of me being ill and getting drunk haven't really added anything of real value to this review, but I've included them for a reason.
Amid normal daily life, when you're not pushing yourself too hard and you're not physically unwell, the recovery percentage doesn't always reflect how you feel. Some days, you feel great, you wake up with a spring in your step and then look at the app to find a yellow recovery score (34 to 66%). The next day, you might get a rough night's sleep and wake up to a green score (67 to 100%).
It's interesting, and somewhat reassuring of its accuracy, to see the red scores (1 to 33%) when you're really not doing well.
Why I stopped wearing the Whoop strap
That leads me nicely to the reason I stopped wearing it for a few months in 2023.
Given the recovery scores don't always reflect how you feel, you can go one of two ways. You can lose trust in the data, or you can put too much trust in it and lose sight of the big picture, which is what happened to me in 2023.
Context: I didn't really have a goal or an event to focus on in 2023, and so my training lacked direction or focus. Without that, I relied on motivation to ride.
On days where I woke up feeling tired, I would choose not to ride. On the days where I woke feeling fine, but with a poor recovery score, it was an immediate excuse – thoughts such as "I probably shouldn't ride today, I'm clearly not rested enough from the last ride," would go through my mind, and before I knew it, I was laying on the sofa once again, feeling guilty.
This was clearly my own poor mental health, rather than something that Whoop needs to improve on, but I think it's an important reminder that like all data, Whoop is only there to inform the big picture. It is not the big picture in itself.
For me, those yellow recovery days were more likely the results of late nights watching TV, the stress of having a puppy in the house and her midnight toilet trips to the garden, earlier starts to walk the dogs before work, a poor diet, and perhaps even my random, staccato training.
Fast forward to 2024, and my training found its focus once again. A half marathon in March, followed by the Gralloch gravel race in May and then Gravel Masters National Championships in August gave me goals to focus on, which in turn gave me motivation to train and a routine once again. I started wearing the Whoop again later in 2023, and despite the increase in training load, my recovery scores are arguably more green than before.
What's different, however, is that I now take the score as a small sense check of how I already feel, rather than letting it tell me how I should feel.
I combine it with the wider context of my recent training, how I've been sleeping, my diet, hydration, and more. I look for longer-standing trends, rather than day-to-day swings. If it's yellow on one day, I'll make an extra effort to get to bed sooner the next night. That's not always possible, but at least I am able to rationalise the lower recovery and continue to follow my training plan. If I notice persistent bad data, such as a high resting heart rate or low HRV for a few days in a row, then I might take a rest day. Importantly, I train more now than I did before, I feel better for it mentally, and by the data, I'm no worse off.
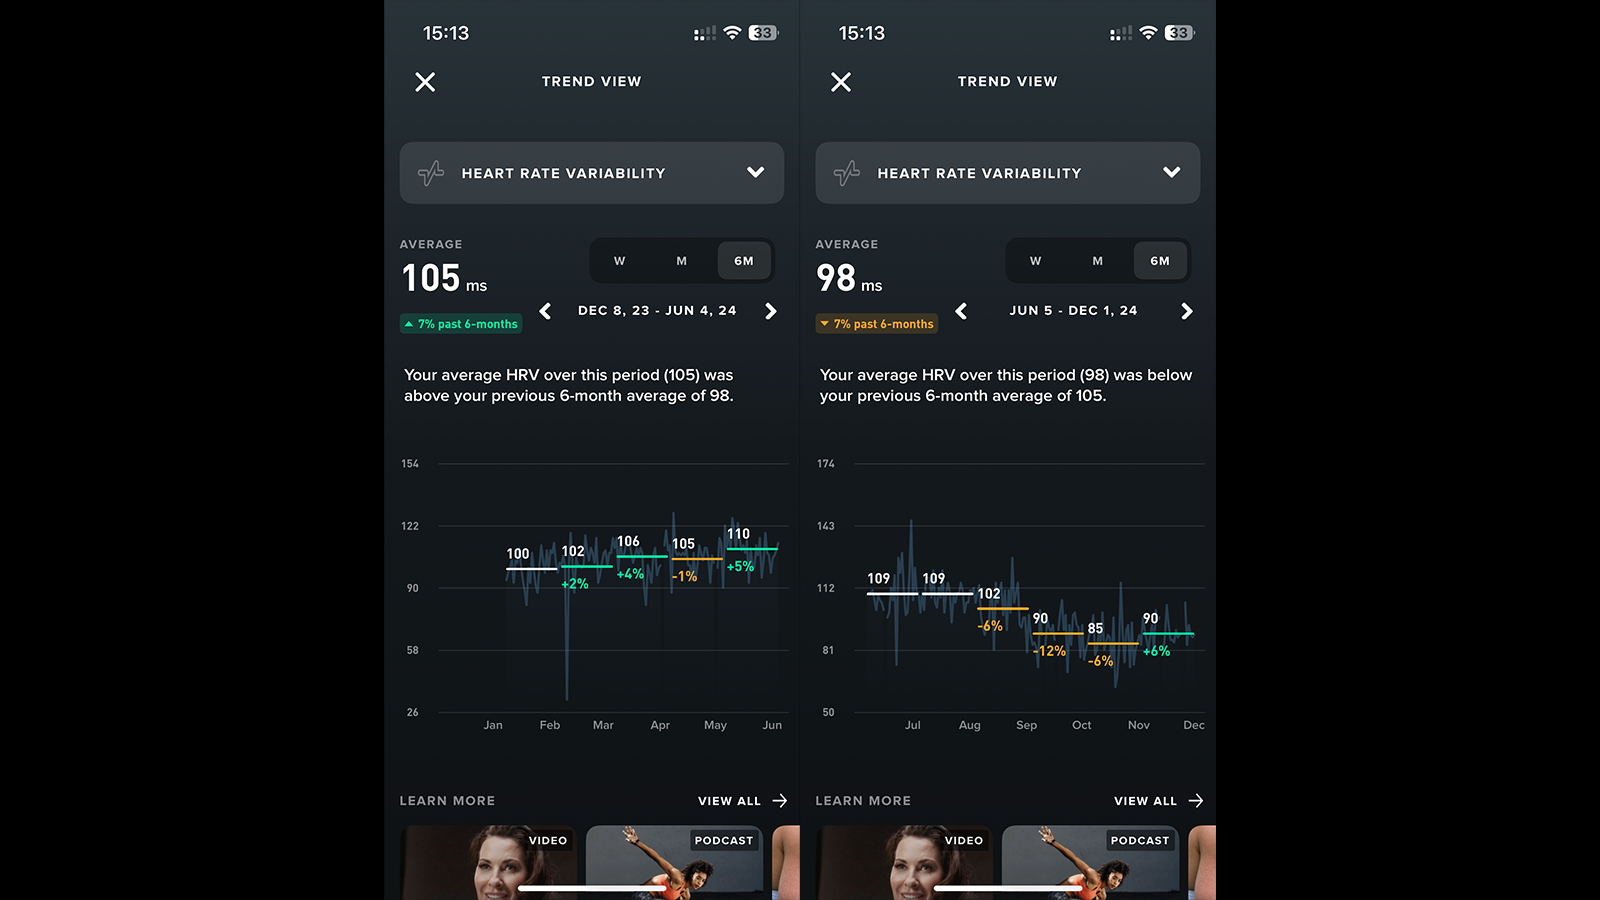
What does overtraining look like in the Whoop app?
With that all said, in the latter half of 2024, I went the other way slightly, and ignored the data too much.
I'd had one of my best seasons in a long time. I trained hard but well, and I had some good results, so in October, when I should have had a rest, my motivation for 2025 was sky high. I took a week off the bike and started training hard again. I was fine for a month, but then in November I got ill, and I carried that illness through December, and still feel the affects of it now in early January.
Looking back at my HRV data, it's clear I was overdoing it. My HRV tends to hover at an average of around 100 to 110ms. But in September it was 98, October it was 90, and by November it has dropped to 86. It was on a clear downward trend, and had I noticed, I would have taken a bit more time off.
Part of me wonders whether Whoop should have been able to spot this trend and flag it in late October, but maybe that's on me.
Is Whoop good value?
For $30 a month, would I say that Whoop is good value? As always, it depends.
It depends on whether you already have a smartwatch that can offer some of the same functions, and what your goals are, how well you can contextualise the data in the big picture, and in how much of a position you are to adjust your lifestyle to action the insights it provides.
If you want something that passively tracks your metrics, then an Apple Watch or a Garmin smartwatch would almost certainly be enough, while also offering a multitude of other functions. They have no monthly fee either, and so their high initial outlay would eventually balance out.
Most importantly though, if you're a professional athlete (or a dedicated amateur), and you're able to adjust your lifestyle, then the depth of data and insight that Whoop can provide could be extremely valuable.
Final verdict: Do I recommend the Whoop 4.0?
Overall, the Whoop 4.0 is a niche and quite unique product. It's aimed at general fitness and health, but in my opinion, it will find most favour among athletes looking to eke out performance gains.
The term biohacking gets thrown around a lot, and although Whoop would probably fall under that category, it feels to me more like a tool that offers genuine and valuable insight into your healthy and unhealthy habits, guiding you gently toward the good ones and away from the bad.
The heart rate accuracy is enough that I would be happy to replace my typical chest-based heart rate monitor with this alone, and although it doesn't include a display, tell the time or offer any of the normal functions of a smartwatch, I don't want it to.
And now that this long-overdue review is written, I will keep on wearing the Whoop 4.0.


