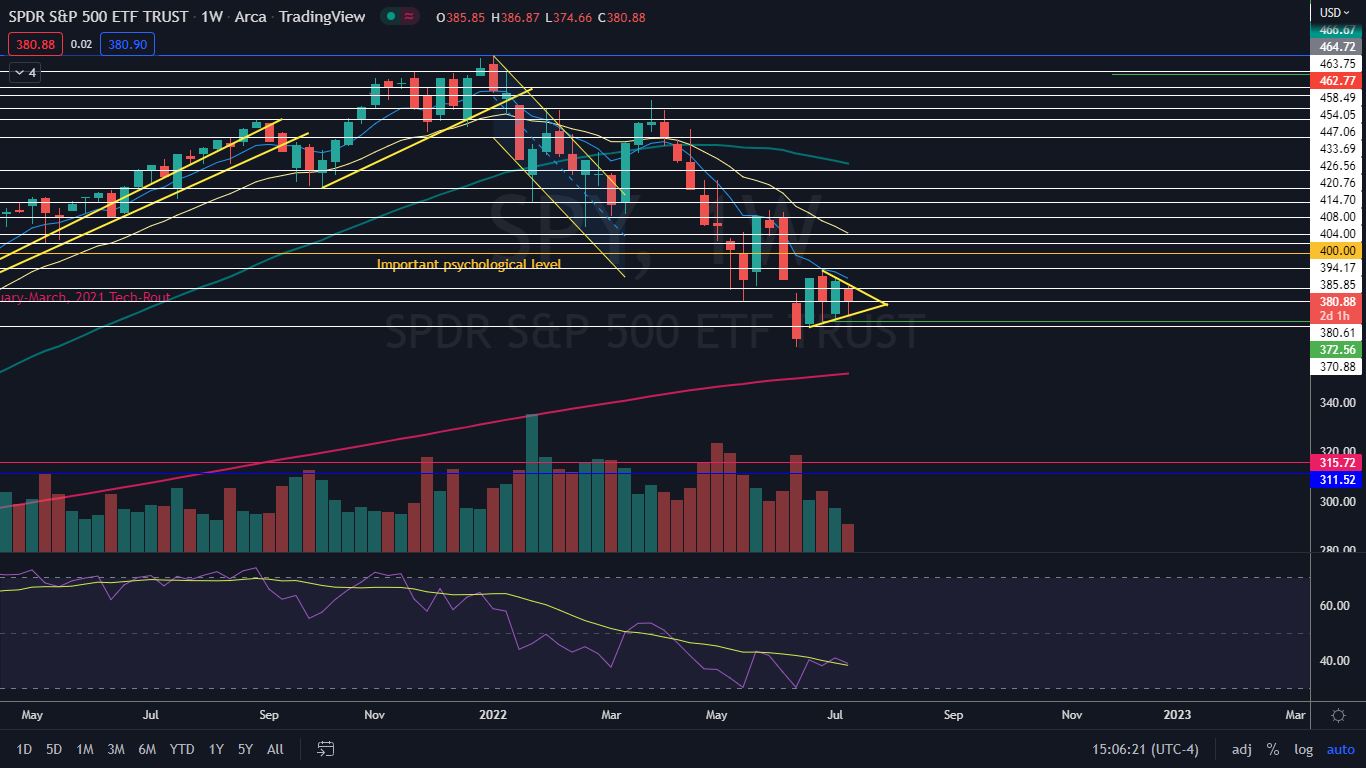
The SPDR S&P 500 (NYSE:SPY) saw dip buyers come in on Wednesday when the ETF gapped down 1.5% to start the trading day after the Bureau of Labor and Statistics released data that showed inflation soared 9.1% year-over-year.
The SPY has suffered a tumultuous year so far, declining about 20% from the Jan. 4 all-time high of $479.98 but enjoying periods of bullishness along the way. The whipsawing prices of the ETF, paired with the SPY sometimes reacting to news in a way that’s opposite of what’s expected, has also caused traders to lose confidence in their convictions of which way the markets are headed.
Although the SPY officially entered into a bear market on June 13, when the ETF plunged a total of 20% off the all-time high, the bulls have remained somewhat powerful in holding the SPY from free-falling. With earnings season quickly approaching, decision time for the ETF may be on the horizon and that, paired with a symmetrical triangle the SPY is settling into on the weekly chart, could set the state for how the markets move during the second half of 2022.
A symmetrical triangle pattern is created when a stock forms a series of lower highs and higher lows between a descending and an ascending trendline, which meet on the right side of the chart to form an apex. The pattern indicates the bulls and bears are equally in control.
A symmetrical triangle is often formed on lower-than-average volume and demonstrates a decrease in volatility, indicating consolidation. The decreasing volume is often followed by a sharp increase in volume when the stock breaks up or down from the pattern, which should occur before the stock reaches the apex of the triangle.
- Aggressive bullish traders may choose to purchase a stock in a symmetrical triangle when the security reverses course on the lower ascending trendline, with a stop set if the stock rejects at the upper descending trendline of the pattern. More conservative traders may wait for the stock to break up bullishly from the pattern on higher-than-average volume.
- Aggressive bearish traders may choose to trade opposite to the bulls, entering into a short position on a rejection of the upper descending trendline and covering the position if the stock finds support at the lower trendline. Opposite to the bulls, conservative bearish traders may wait for the stock to break down from the lower trendline on higher-than-average bearish volume.
Want direct analysis? Find me in the BZ Pro lounge! Click here for a free trial.
The SPY Weekly Chart: The SPY began settling into a symmetrical triangle the week of June 27, with decreasing volume indicating consolidation on the weekly chart. The ETF is set to hit the apex of the triangle the week of Aug. 1, making it likely the SPY will break up or down from the pattern before that date.
- Traders and investors can watch for increasing volume to come in when the SPY breaks up from the descending trendline of the triangle or down from the ascending trendline of the pattern to gauge whether the pattern has been recognized.
- The pattern leans slightly bearish because if combined with the steep decline between the weeks of April 4 and June 13, the SPY may be settling into a bear flag pattern. If the flag formation becomes the dominate pattern and the ETF breaks down from the triangle, bullish traders will want to see the SPY bounce off the 200-day simple moving average.
- If the SPY breaks up bullishly from the pattern and regains the eight-day exponential moving average as support, the ETF may form a new uptrend, which would give bullish traders more confidence going forward. If the SPY is able to close this week above $381, the ETF will print a hammer candlestick on the weekly chart, making a bullish break from the triangle more likely.
- The SPY has resistance above at $385.85 and $394.17 and support below at $380.61 and $370.88.


