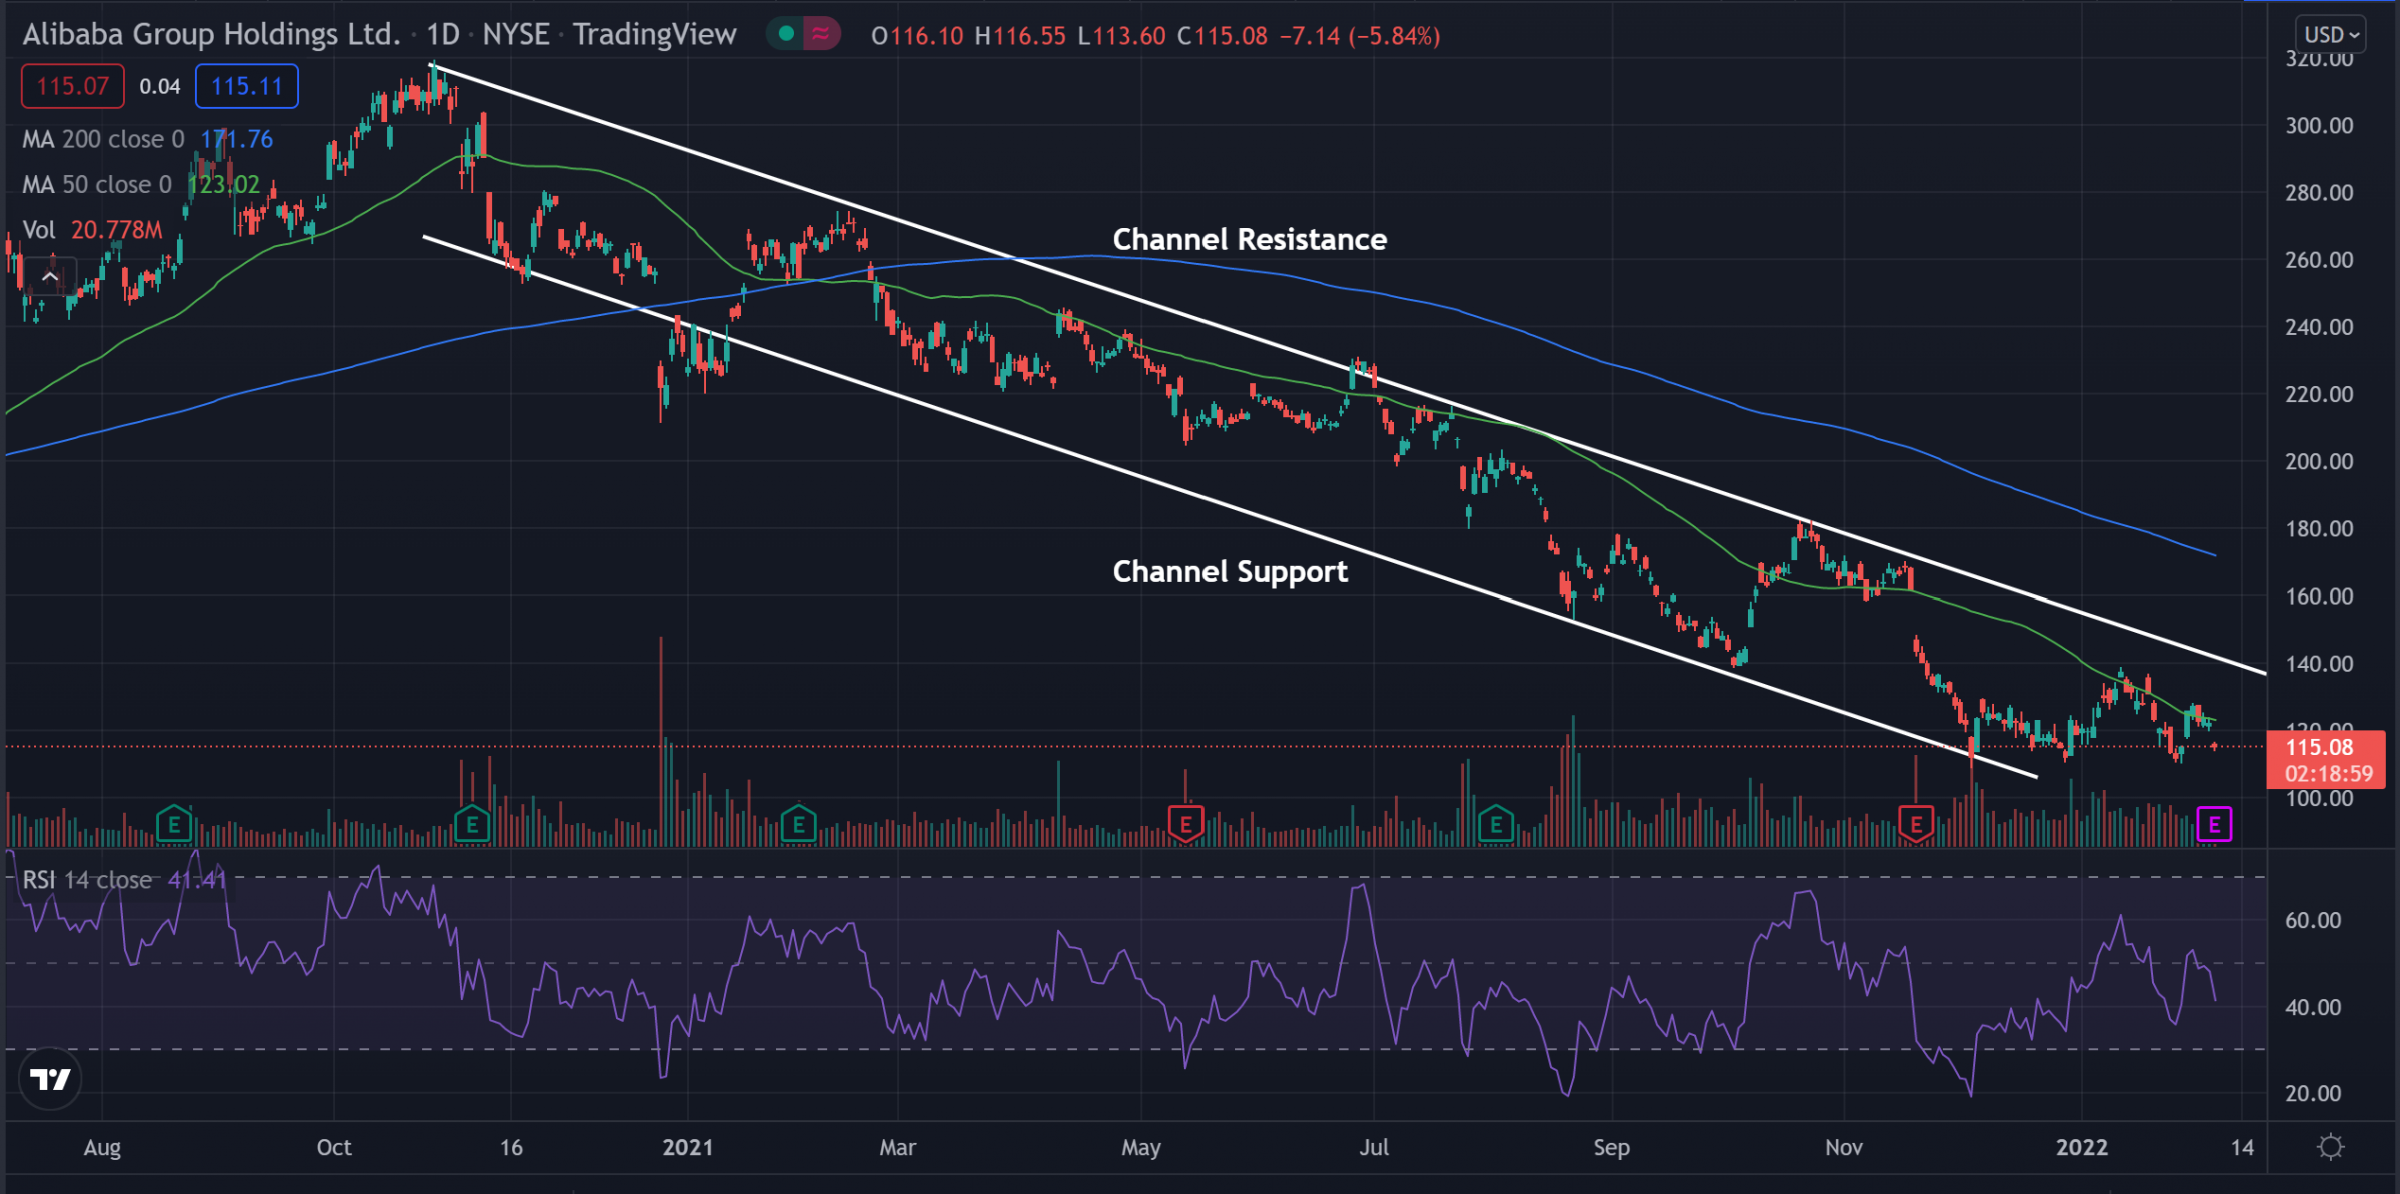
Alibaba Group Ltd. (NYSE:BABA) shares are trading lower Monday amid media reports speculating that Softbank may sell part of its stake in the company. The stock continues to decline, trading within in a descending channel pattern.
Alibaba was down 5.74% at $115.21 at last check.
See Also: Here's What Citi Thinks Of Alibaba's ADS Issuance
Alibaba Daily Chart Analysis
- The stock has been consistently dropping in what traders call a descending channel pattern. Connecting the highs and lows on the chart shows a parallel channel that is trading with downward sloping lines. The stock may continue to trend lower until it can break above the resistance in the channel.
- The stock trades below both the 50-day moving average (green) and the 200-day moving average (blue). This indicates bearish sentiment, and each of these moving averages may hold as an area of resistance in the future.
- The Relative Strength Index (RSI) has been climbing and forming higher lows for the past couple of months and now sits at 41. This shows that the stock is seeing more buyers entering the market, although there still are more sellers overall. If the RSI can cross the middle line, the stock may start trending upward as there would be more buyers.

What’s Next For Alibaba?
The price continues to stay within the long-standing downward channel. For the price to begin to turn around, traders are looking for the RSI to climb and for the price to cross above the resistance lines.
Bullish traders want to see an RSI push above 50 and for the price to cross and hold the resistance level.
Bears are looking to see the stock be unable to break over resistance and for the RSI to fall back into the oversold region under 30.
Photo: Courtesy of alibabagroup.com


