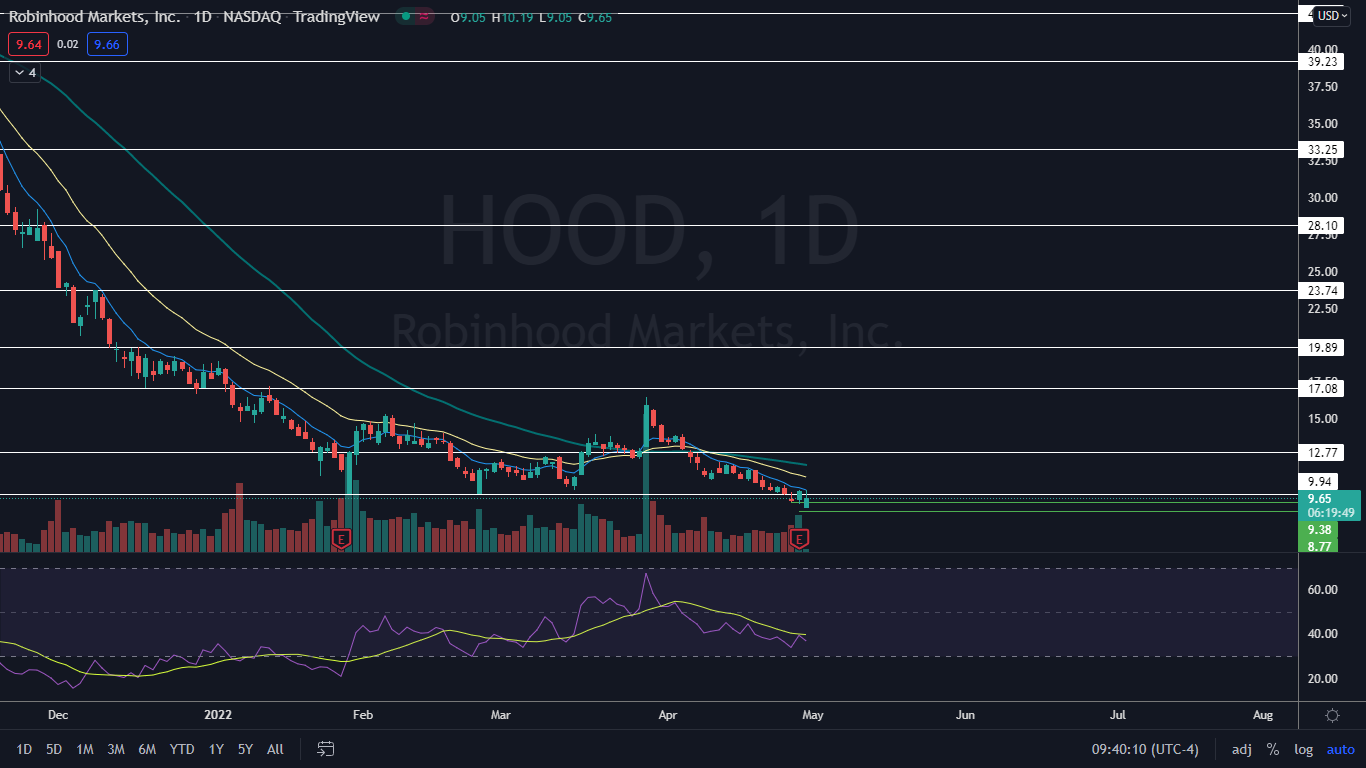
Robinhood Markets Inc (NASDAQ:HOOD) rallied more than 6% into its first-quarter earnings print but the trading platform’s results caused the stock to plummet to a new all-time low of $8.77 at 5:45 p.m. in after-hours trading on Thursday.
Robinhood reported a massive miss, printing a net loss of 45 cents per share on revenues of $299 million compared to the consensus estimate of a loss of 36 cents per share on revenues of $355.8 million. The company also reported its monthly active users were down 10% over the same period the year prior.
On social media sites such as Reddit and Twitter Inc (NYSE:TWTR), traders, investors and apes (who like elephants never forget) continue to voice outrage over Robinhood CEO Vlad Tenev’s decision to restrict trading on a number of stocks, including GameStop Corp. (NYSE:GME) and AMC Entertainment Holdings Inc (NYSE:AMC) in January of last year, which tied the hands of retail traders who were unable to exit their positions.
Robinhood has attempted to bring retail traders back to its platform, most recently listing popular cryptocurrencies such as Shiba Inu (CRYPTO: SHIB) and extending trading hours on its app, but Robinhood’s earnings print indicates its efforts aren’t paying off.
The stock has been declining since Aug. 4, 2021, just five days after its debut, plunging almost 90% since that date. On Friday when the markets opened, bulls came in to buy the dip off the new all-time low, but Friday's candle will need to print to determine whether a trend change could be on the horizon.
Want direct analysis? Find me in the BZ Pro lounge! Click here for a free trial.
The Robinhood Chart: Robinhood’s most recent downtrend began on March 29 with the most recent lower high printed on Thursday at $10.20 and the most recent confirmed lower low formed at the $9.38 level on Wednesday. For Robinhood to confirm a trend change over the coming trading days, it will need to rise above the $10.20 level and then fall down to print a higher low above $9.38.
- Robinhood looked on Thursday as though an uptrend may begin because the price action on that day, combined with Wednesday’s price action set the stock into a double bottom pattern on the daily chart. When Robinhood opened Friday’s session at the $9.05 level, the bullish pattern was negated.
- At least a bounce is likely to come over the following few days because Robinhood’s relative strength index (RSI) is measuring in at about 34%. When a stock’s RSI nears or falls to the 30% level it becomes oversold, which can be a buy signal for technical traders.
- Robinhood has resistance above at $12.77 and $17.08 and support below at $10 and the all-time low.


