Torsten Asmus for iStockphoto; Canva
Bonds are fixed-income securities. When an investor buys a bond, they are making a loan to a borrower, such as a corporation or the federal government. In return for lending them money over a set timeframe, the corporation or the federal government, known as the bond issuer, offers its bondholders incentives in the form of interest payments, called the coupon, or the yield.
What Is a Yield Curve?
A yield curve is a line that shows how bonds' interest rates change depending on their length to maturity. Here, a bond's position on the Y-axis would represent its interest rate, and its position on the X-axis would represent its term.
While most bonds mature in 30 years or fewer, their yields vary based on their length to maturity and creditworthiness. Longer-term bonds typically offer higher yields to compensate the investor for the risk that they are taking in making such a lengthy loan, because the chances are that interest rates, which move inversely to bonds, will rise before the bond matures, thus lowering the bond’s value.
What Is the Relationship Between Treasury Bonds and the Yield Curve?
When an investor purchases a Treasury bond, it’s like they are loaning money to the U.S. government. These investments come with the highest credit rating (AAA) and are often considered to be safer than stocks—virtually risk-free because they are backed by the “full faith and credit” of the federal government, which is pretty much guaranteed never to default.
The U.S. Department of the Treasury publishes Treasury bond yields on its website every day after market close. This includes yields for Treasuries ranging from as short as 1 month to as long as 30 years. The yields are obtained by the Federal Reserve Bank of New York and are based on market prices. Graphically plotting the rates of the individual Treasuries creates what is known as a yield curve.
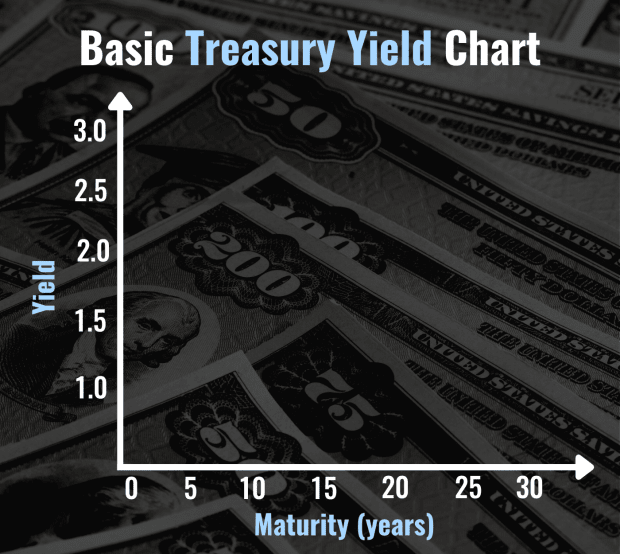
The X-axis illustrates the time to maturity, while the Y-axis depicts the yield. The most widely reported yield curve illustrates 3-month, 2-year, 5-year, 10-year, and 30-year Treasury yields. The slope of the yield curve is measured by comparing the yields between the 2-year Treasury and the 10-year Treasury.
Why Is the Yield Curve So Important?
Both analysts and investors use indicators such as consumer prices, jobs reports, and GDP growth to gauge where we stand in the economic cycle—and then act on this information in the form of buy/hold/sell decisions.
In a similar way, they use ratios, such as alpha and beta for mutual funds, as a way to benchmark their performance, again acting on this information in the hopes of generating profits. Likewise, the yield curve is a popular metric because Treasuries are a debt instrument that can be benchmarked. They are easily comparable—because as we mentioned above, all Treasuries have the same credit rating (AAA).
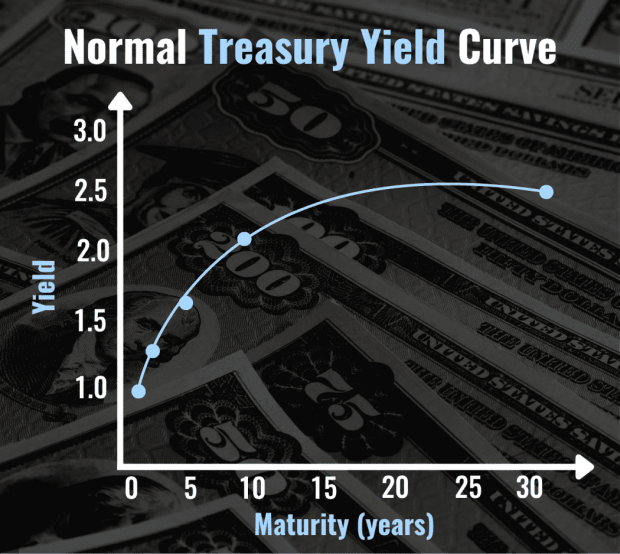
What is a “Normal” Yield Curve? What Does It Indicate?
Normally, longer-term Treasuries have higher yields than shorter-term Treasuries because, as we mentioned earlier, the bond issuer—in this case, the U.S. government—rewards investors with more incentives for giving them longer-term loans. See the chart above. Here, the yield curve naturally floats upwards. In this scenario, when longer-term Treasuries have higher yields than shorter-term Treasuries, all is said to be functioning well and the economy is growing—at least from this indicator.
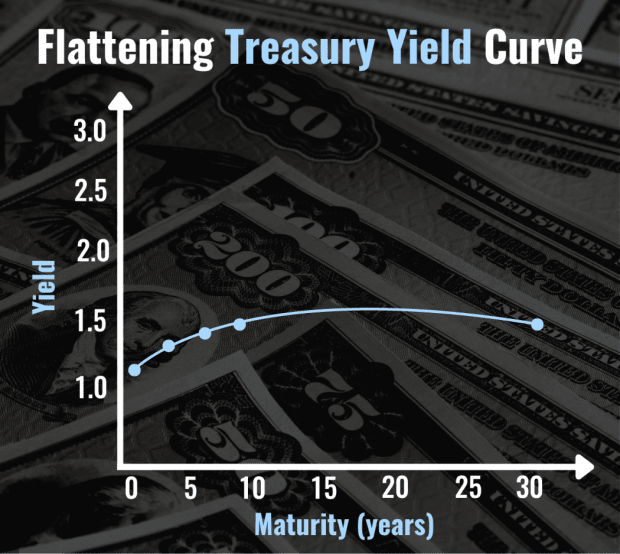
What Is a Flat Yield Curve? What Does It Mean?
When the yields between long-term and short-term Treasuries become similar, the yield curve is said to flatten. This indicates a time of uncertainty—even confusion. Investors could be anticipating interest rate hikes from the Federal Reserve, higher inflation, or other evidence of dwindling confidence in the economy.
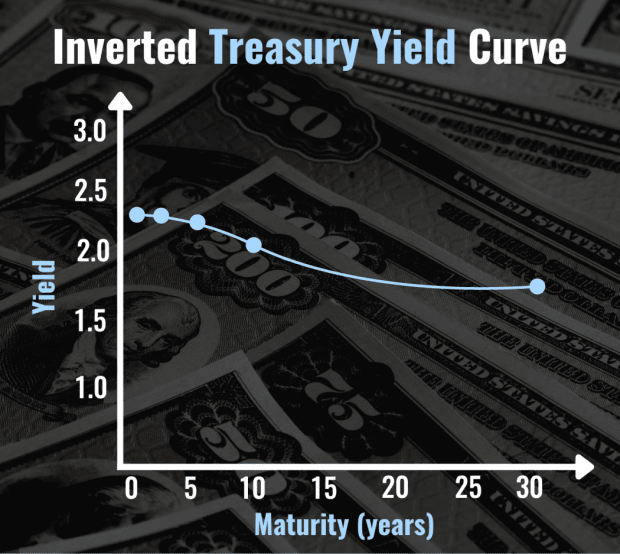
What Direction Is an Inverted Yield Curve? What Does It Mean When the Yield Curve Inverts?
The chart above accurately describes an inverted yield curve. Here, it looks like the curve we are used to associating with Treasuries flips, or inverts. Instead of sloping upwards, now the curve trends downward, because short-term Treasuries—specifically the 2-Year Treasury—have higher yields than longer-term bonds, specifically the 10-year Treasury.
Why Do Inverted Yield Curves Predict Recession?
Why would an investor buy a longer-term Treasury and take on more risk when a shorter-term Treasury offers a bigger payout with less risk? That is the fundamental question behind yield curve inversion. It doesn’t make sense for investors to take on more risk for less reward. It also forespells waning confidence in both the U.S. economy—and the federal government. Stocks typically sink on the news and pessimism takes center stage, often to fester for quite some time.
Yield Curve inversion has been a reliable indicator of future recession, although analysts are careful to note that this phenomenon cannot tell us exactly when a recession will happen.
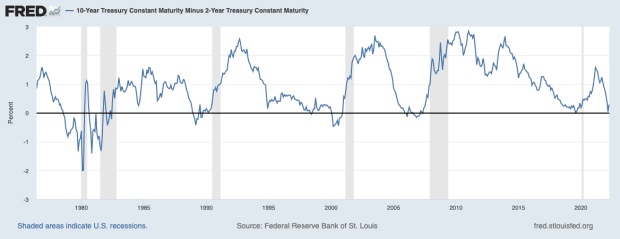
According to data from the St. Louis Federal Reserve, the lag between yield curve inversion and recession has been anywhere from 6 months to 3 years. The blue line in this chart from the St. Louis Federal Reserve illustrates yield curve inversion when it dips below 0, while the grey bars indicate periods of recession.
Since the economy historically averages a recession once every five years, however, critics are quick to ask how much of a predictor the yield curve really is.
Where Is the Yield Curve Right Now?
On April 1, 2022, the yield on the 2-Year Treasury exceeded the yield on the 10-Year Treasury, causing a phenomenon known as an inverted yield curve. The last time that happened was in 2019. TheStreet’s Dan Weil says that while many of the pundits are shouting recession, a stock rally might be coming.