What Is the Richmond Manufacturing Index?
The Richmond Manufacturing Index is a widely followed monthly economic indicator of a region that includes Middle Atlantic states. The survey focuses on manufacturing activity within that region and measures sentiment and expectations among executives in the private sector. Types of manufacturing range from food and textile to fabricated metal products and machinery.
The survey is formally known as the Fifth District Survey of Manufacturing Activity, which refers to the area overseen by the Federal Reserve Bank of Richmond—one of 12 Reserve Banks under the Federal Reserve. The Fifth Federal Reserve District covers the District of Columbia, Maryland, North Carolina, South Carolina, Virginia, and most of West Virginia. The survey is also referred to as the Richmond Fed Survey.
In the 1980s, the Richmond Fed was tasked with developing a survey on its region because there had been no regional survey comparable to the national survey on manufacturing, known as the purchasing managers’ index, which is compiled by the Institute for Supply Management (known then as the National Association of Purchasing Management).
Who Compiles the Richmond Manufacturing Index?
The Richmond Fed first released its manufacturing survey in 1986, and it was conducted every six weeks. It moved to a monthly format in 1993, and because of the popularity of its survey on manufacturing, the bank branched out to cover the services sector. That survey is known as the Fifth District Survey of Service Sector Activity.
According to the bank, the manufacturing survey is sent to executives at manufacturers within the bank’s district two business days after the previous month's results are published, and the data collection ends three business days before the results are published. Respondents are asked a series of questions to compare business conditions from the latest month to the previous month. The results are then compiled as diffusion indexes, which measure the dispersion of change—this is the same way that the purchasing managers’ index is calculated.
The survey on manufacturing covers different aspects of business, such as shipments, new orders, order backlogs, capacity utilization (usage of equipment), supplier lead times, number of employees, average work week, wages, inventories of finished goods, and capital expenditures. Typical questions include whether local business conditions increased, decreased, or stayed the same, and whether those conditions will change in the next six months.
Investors and analysts focus on the headline number of the Richmond Fed’s composite manufacturing index. A reading greater than zero suggests expansion in manufacturing, while a reading of less than zero indicates contraction.
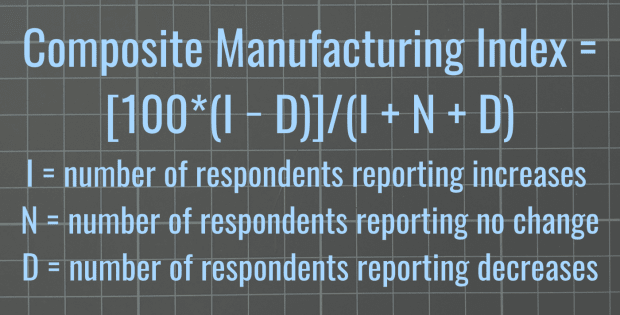
What Is the Formula for the Richmond Manufacturing Index?
The Richmond Fed uses the basic formula for the diffusion index in calculating the manufacturing index and subindexes.
As of 2021, the Richmond Fed’s business surveys covered 198 firms in manufacturing and 418 in the services sector.
Why Is the Richmond Manufacturing Index Important?
The survey is closely watched because, unlike other leading economic indicators that are backed by data on prices and units, it relies on answers provided by executives about their outlook on business conditions. The survey is often viewed as a reliable predictor of the economy. And even though it covers a particular region, it is often representative of manufacturing activity across the U.S.
Subindexes such as wages might indicate whether inflationary pressures are picking up, or whether companies are holding back on spending amid concerns of the economy slipping into recession.
Below is a graph of the Richmond Fed’s composite manufacturing index over a 10-year period, from mid-2013 to mid-2022.
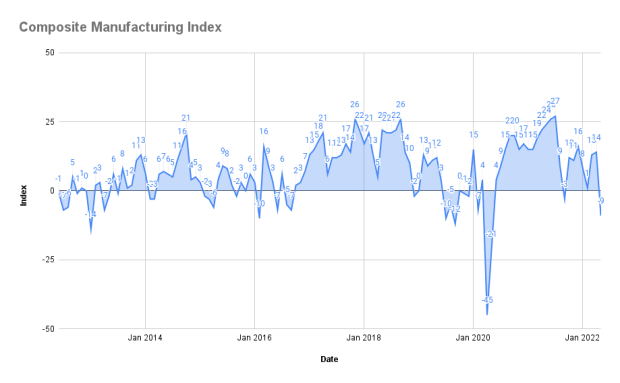
The index’s steep decline coincided with the economy contracting around the beginning of the COVID-19 pandemic early 2020. But manufacturing picked up soon after in succeeding months.
When Is the Richmond Manufacturing Index Released?
The survey is released at 10 a.m. ET, on the fourth Tuesday of the month.
Upcoming Release Dates in 2022
How Do the Stock and Bond Markets React to the Richmond Manufacturing Index?
Financial markets generally react positively to positive results from the Richmond Manufacturing Index and react negatively to bad numbers. Investors and analysts view the manufacturing survey as a leading indicator on the economy, and they also focus on subindexes and the survey on the services sector for additional clues on where the economy might be headed.