What Is a Dead-Cat Bounce?
A dead-cat bounce is a brief rise in price for a security or asset following a lengthy decline.
The term “dead-cat bounce” came about in the 1980s as part of colorful commentary to describe false rallies. A false rally is typically a temporary rise in stocks after a period of decline. When this happens, investors tend to believe that prices have bottomed out and that a prolonged recovery is likely, but a rally fails to follow through. Such a rally can be thought of like a dead cat—even if a dead cat bounces off the floor, it’s still dead.
Other terms for dead-cat bounce are short-lived rally, or sucker’s rally.
How Long Does a Dead-Cat Bounce Last?
A dead-cat bounce is a temporary period of gains and typically lasts a day or a few days, or sometimes as long as a few weeks. Still, it is difficult to determine, and investors are typically conditioned back into the market with the “buy-on-the-dip” mentality.
How to Spot a Dead-Cat Bounce
A dead-cat bounce is difficult to spot in real-time pricing but can be spotted historically. For example, when a bear market follows a lengthy bull market, there are likely to be instances of temporary rises during a bear market but higher prices aren’t likely to be sustained.
One way to spot a dead-cat bounce is to weigh the fundamentals of the market. During the first half of 2022, some companies’ stock prices fell 20 percent or more from their highs, which characterizes their shares falling into bear market territory.
Dead-Cat Bounce Example: JPMorgan Chase (NYSE: JPM)
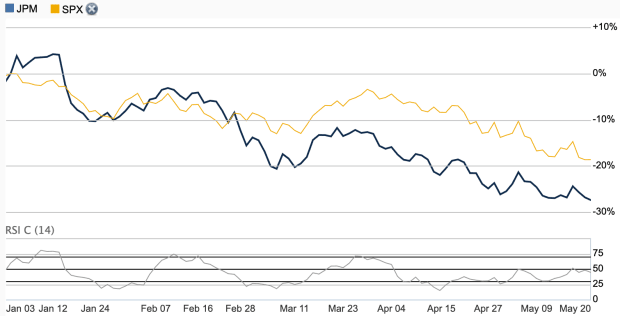
Examine the price chart for JPMorgan Chase below—its shares fell 27 percent from the start of the year to May 20, 2022, compared to the S&P 500 Index’s 19 percent decline. The stock had peaked in late 2021, after a lengthy bull run that started in April 2020. Share prices for many companies dropped to multi-year lows a month before, in March 2020, when the Covid pandemic raised concerns of a slowing U.S. economy.

As the Federal Reserve tightened monetary policy in the first half of 2022 to control inflation, investors worried about rising interest rates cutting into the bank’s profitability. Higher borrowing costs might cause consumers to take out fewer loans, which, in turn, might drag down interest income—typically the main source of profit for many banks.
As JPMorgan’s shares experienced moments of price gains, the overall trend in the first half of 2022 was downward. That means investors who bought the bank’s shares during those brief periods of gains in late January and mid-March were left with paper losses.
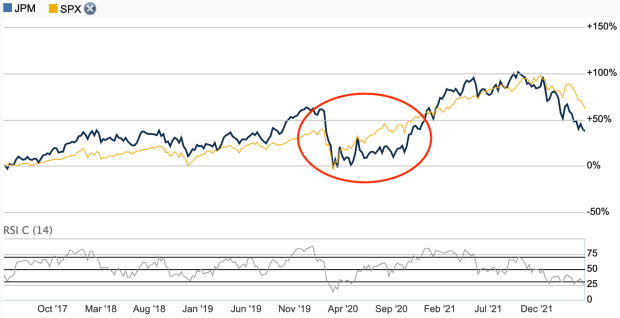
Compare JPMorgan’s stock price to that of March 2020, at the start of the Covid pandemic, in the chart below. Prices fell precipitously in March 2020 but recovered soon after in April and the months afterward, as concerns about the U.S. slipping into recession eased. While that was a sudden reversal in price, dead-cat bounces are the opposite and can lead investors to put their money into the market as share prices continue to decline.

Uses in Technical Indicators
Certain technical indicators can illustrate a dead-cat bounce. In the 14-day relative strength index for JPMorgan, seen in the charts above, the indicator showed the stock was oversold during some days from January to May. Even as the price dropped to below the RSI level of 30 that suggests buying, shares continued to decline. That might mean that technical indicators such as relative strength aren’t reliable in predicting the future price trend of a stock, and investors might be lured into believing a reversal is likely to occur.


