What Are Open and Close Prices?
When watching the news, you might hear financial pundits discussing the prices at which certain stocks—or even stock indexes like the S&P 500—“opened” or “closed.” But just what do these terms mean?
To understand opening and closing prices, it’s important to first understand how stock exchanges work. In the U.S., most stocks trade either on the New York Stock Exchange (NYSE) or the Nasdaq, and each of these markets opens and closes at prescribed hours—just like your favorite coffee shop or grocery store.
The NYSE is open for trading from 9:30 a.m. to 4:00 p.m. Eastern time, Monday through Friday, excluding holidays. Conveniently enough, the Nasdaq operates during these same hours.
The first time a stock is purchased on the NYSE or Nasdaq each day, the price its buyer pays for it becomes its opening price for that day. Similarly, the last time a stock is sold before the market closes at 4:00, the price its buyer pays becomes its closing price for that day. In other words, a stock’s open price is a snapshot of its value as of 9:30 a.m. on the most recent day of trading, and its close price is a snapshot of its value as of 4:00 p.m. on the most recent day of trading.
It’s important to note that trading does take place both before markets open and after they close, but the majority of transactions take place during regular market hours, so investors and analysts pay close attention to open and close prices in order to monitor whether certain stocks have gone up or down in value during the last trading session.
What Are High and Low Prices?
Open and close prices are sort of like a stock’s bookends for each trading station. They are the prices used to determine whether a stock gained or lost value over the course of a given day. That being said, stocks do not always remain between their open and close prices each trading day—they often reach intraday highs and lows that surpass their open and close values.

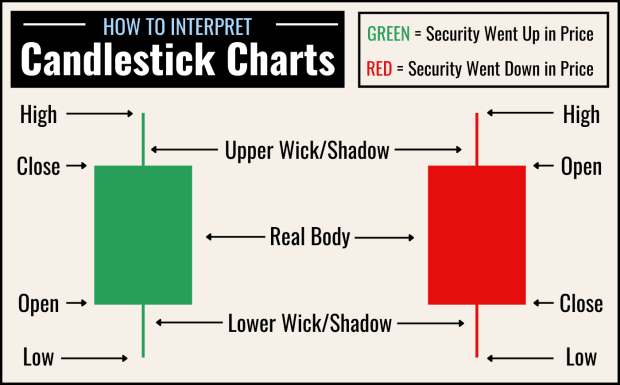
The best way to visualize a stock’s single-day open, close, high, and low prices is via a candlestick chart. These charts display a vertical bar with lines extending from its top and bottom for each trading session.
If a stock closed higher than it opened, then the top of the candle represents its closing price, and the bottom represents its opening price. If a stock closed lower than it opened, the opposite is true. In either case, the candle’s top “wick” represents a stock’s intraday high, while the bottom wick represents its intraday low.
Why Don’t Stocks Open at Their Previous Close Prices?
If a stock’s closing price was $5 at the end of a day’s trading session, you might assume that its opening price the following morning would be $5 as well, but in practice, this is rarely the case. Most often, stocks go up or down in price (by at least a little bit) during the hours when markets are closed.
A stock’s price—at any point in time—is determined by supply (the ask side of the market) and demand (the bid side of the market). When supply exceeds demand, a stock’s price falls until equilibrium is reached; when demand exceeds supply, a stock’s price rises. Due to both after-hours trading (which is allowed by some brokerages) and queued buy and sell orders waiting to execute when the market opens, the ratio of supply to demand for a given stock continues to fluctuate after markets close, causing its price to fluctuate in step.
News that is released when markets are closed can impact a stock’s supply and demand significantly—sometimes so significantly that its opening price can be radically different from its previous close. For instance, if a company hosts an earnings call after the market closes, and it beats its earnings estimate by a significant margin, its open price the following day might be significantly higher than its previous close.


