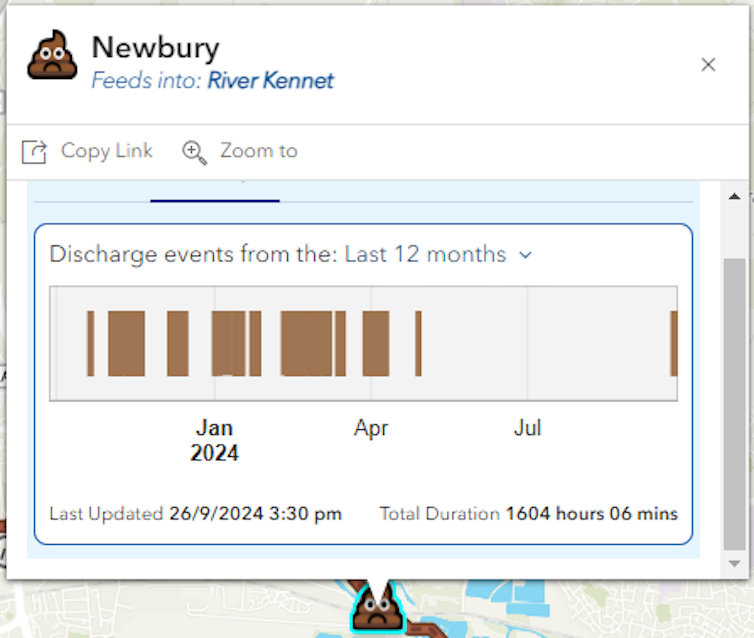
For the first time, anyone in England can now access real-time information of where combined sewer overflows (CSOs) are discharging untreated wastewater into our waterways. This week, all water companies published details of how anyone can access the status of thousands of “event duration monitors”, devices that are placed on CSO outlets to record whether they are discharging sewage.
This recent data release is not, however, driven by some inspired act of transparency by water companies. An impending new law is forcing them to. Section 81 of The Environment Act comes into force in January, obligating them to make event duration monitor data “readily accessible to the public”.
As a scientist studying river pollution, this data release is incredibly welcome. Since early 2024, water companies have been sharing maps of where sewage spills are happening but restricting access to the underlying data. As a result, members of the public have had to rely on the data visualisation choices made by the water companies. Unfortunately, the resulting maps may not be showing exactly what people want to see.
It seems obvious that people concerned about the safety of bathing water would want a map that highlights active sewage spills. Several water companies, however, seemed to disagree with this logic, producing maps where spills were obscured by non-spill icons unless you zoomed in, making it challenging for the public to quickly identify discharges.
But now, with raw data publicly available, it will be possible for other organisations to generate visualisations more centered on the public interest.
With geospatial developer Jonathan Dawe, I created such a tool, SewageMap – an open-source, free website which shows where spills are occurring in the Thames basin and, crucially, highlights which rivers are downstream of an active discharge. While the limited information provided by current overflow monitors means this map cannot provide risk information, it still provides useful, clear insights to swimmers, academics and citizen scientists.
Open data has been essential to its success. Thames Water, to its credit, opted to release its CSO data in January 2023, almost two years before other water companies and the legal deadline to do so (January 2025).
This open data enabled us to build our visualisation for the Thames, and the data was rapidly and widely used by other people too. The volunteer-led site Top of the Poops rapidly incorporated live information into its data dashboards. Environmental charities such as the Rivers Trust and Surfers Against Sewage, as well as journalists, now routinely use this data to communicate with the public.
Academics have also benefitted from access to overflow monitoring data. Nick Voulvoulis, a professor of environmental technology, and collaborators used this data to diagnose capacity limitations with the UK’s sewerage network.
This clear demand and capacity for open environmental data stands in stark contrast to the view of a senior lawyer for South West Water’s parent company, who claimed that “it is the regulators and not the press or the public” which should have access to data on sewage spills. We have a long way to go to change this attitude.
Notably, most companies are now only releasing the current status of CSO monitors which the Environment Act requires them to do, and no more. Take information about historical sewage spills. Let’s imagine there is a CSO in your local river – if you’d like to know if it is discharging today, you can, now, easily find out.
However, if you’d like to know when it discharged in the last year, it is harder, if not impossible, to find out. This seems surprising as this historical data is automatically gathered by the same monitors used for the recent release. It would be trivially easy to make this historical data public at the same time. Indeed, Thames and Southern Water have voluntarily opted to do so (again, to their credit). If they can do it, why can’t other water companies?

A trickle of transparency
Equally as important as open data is transparency over the scientific models used to make decisions off the back of it. Unfortunately, many models used by the water industry are “closed source”, meaning that the underlying code and data cannot be publicly accessed or scrutinised.
This means that from the public’s perspective, the models operate as a “black box” where it is unclear how they reach decisions. For instance, Southern Water operates an online tool, Rivers and Seas Watch (previously known as BeachBuoy), that uses a model to determine if a spill alert is “genuine” and “impacts” bathing water.
In an independent review of this tool, lack of transparency of how the model made decisions was cited as a key reason users didn’t trust its outputs. And in a recent study, Alex Ford, professor of biology at the University of Portsmouth, and his citizen scientist collaborators queried the validity of some of the outputs.
Southern Water has now taken steps to improve the model’s transparency, including publishing the independent review in full. However, the tool still relies on a proprietary closed-source hydrodynamic model to make decisions.
Worryingly, government regulators are also using closed-source software to make decisions about our rivers. Sagis is a model used to predict the sources of pollution into rivers, and self-describes as “the regulatory agencies’ (Environment Agency, Natural Resources Wales and the Scottish Environment Protection Agency) primary catchment planning tool until at least 2027”.
However, a colleague and I recently raised concerns that Sagis, which was developed by the water industry, is proprietary, closed source, and challenging to scrutinise. Notably, this seems to be against the government’s own guidance to use open-source software.
The growing availability of overflow monitoring data is positive, and I am excited to see what great things citizen scientists, academics and environmental charities can do with it.
However, there is still so much environmental data about our rivers that is far too hard to access, and proprietary, closed-source models are the norm. We need to rebuild public trust in our river – and sewer – networks. Greater transparency would be a good place to start.

Don’t have time to read about climate change as much as you’d like?
Get a weekly roundup in your inbox instead. Every Wednesday, The Conversation’s environment editor writes Imagine, a short email that goes a little deeper into just one climate issue. Join the 40,000+ readers who’ve subscribed so far.
Alex Lipp does not work for, consult, own shares in or receive funding from any company or organisation that would benefit from this article, and has disclosed no relevant affiliations beyond their academic appointment.
This article was originally published on The Conversation. Read the original article.


