Once a growth-stock darling, Upstart Holdings (UPST) has been under intense selling pressure throughout the bear market.
In the preceding bull market, Upstart shares rallied by a factor of more than 16. The stock then fell 97% from the all-time high.
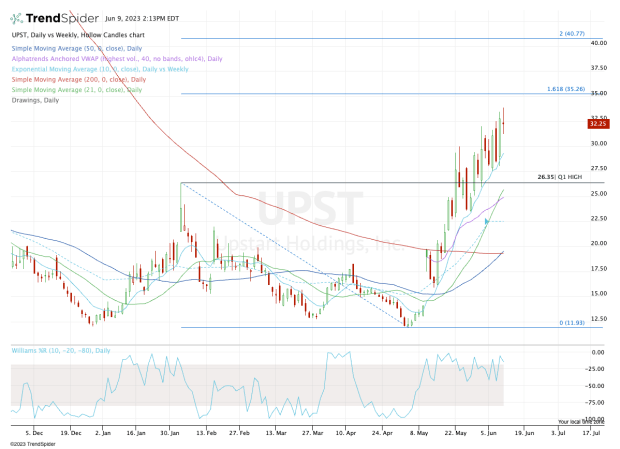
Upstart stock bottomed at $11.93 in early May. Most tech stocks — and by extension, most stocks overall — bottomed in the fourth quarter.
But the company describes itself as a “leading artificial intelligence lending marketplace,” and investors know how well AI stocks have been performing.
Nvidia (NVDA), Advanced Micro Devices (AMD), C3.ai (AI) and others have been exploding higher.
Don't Miss: Are Growth Stocks Back? Trading Cathie Wood's ARKK ETF
Upstart shares also took off on its earnings report, rallying more than a third (34%) on May 10 and 40% in the following week after the results.
The stock made a year-to-date high on Friday, up an impressive 183% from the May low.
So how do bulls approach a stock like this?
Trading Upstart Stock

Chart courtesy of TrendSpider.com
Before looking at the setup, we must note how volatile this stock has been.
In the past 21 sessions, roughly one month of trading, Upstart stock has had a daily gain or loss of at least 10% (on a closing basis) in 10 of those sessions (or 47.5% of the time.
Further, it had a daily gain or loss of at least 4% (again, on a closing basis) in 18 of those sessions (about 86% of the time).
With that in mind, investors looking to buy or sell Upstart stock should consider smaller positions to account for this volatility.
Don't Miss: Small Caps Are Breaking Out. How Long Can Investors Ride the Wave?
On the dips, the bulls have been defending the rising 10-day moving average.
But if the stock corrects sharply, then the first-quarter high could be in play at $26.35, with the rising 21-day moving average and daily VWAP measure just below this mark.
If that area fails, then a dip all the way down to the 50-day and 200-day moving averages near $20 could be in play.
On the upside, a continued rally could put the 161.8% extension in play near $35, followed by the two-times range extension, up between $40 and $41.
Get exclusive access to portfolio managers and their proven investing strategies with Real Money Pro. Get started now.


