Extreme temperature and rainfall events are increasing around the world, including Australia. What makes them extreme is their rarity and severity compared to the typical climate.
A region’s “climate” is defined by a 30-year average of mainly rainfall and temperature. Increasingly, these climate definitions have become less appropriate – we need to look at events over shorter time periods to gain a more accurate picture.
We can see this in the recent worldwide proliferation of extreme flooding and prolonged heatwaves.
Using southern Australia as a prime example, our newly published research in Academia Environmental Sciences and Sustainability shows that machine learning techniques can help identify key climate drivers, supporting a redefinition of climate in a warming world.
Increasing ‘flash’ events
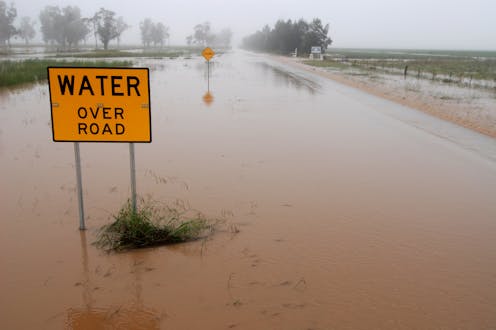
In Australia, eastern coastal regions of Queensland and New South Wales continue to receive record downpours and flash floods, interspersed by dry periods of a few months to a few years.
In stark contrast, southern coastal regions are drying and facing more extreme heatwaves. With already parched vegetation and catastrophic fire dangers, this region is experiencing drought conditions due to decreased cool season rainfall and increased temperatures.
Notably, flash droughts and flash floods have adversely affected both agricultural crop yields and grazing pasture quality. Flash droughts greatly reduce moisture for germination. Flash floods ruin crops close to harvest time.
The problem with these “flash” events is just how difficult they are to forecast. To make more accurate seasonal and annual predictions for rainfall and temperatures, we need to update our climate models. But how do we know which climate drivers need to be included?
Seeking a new normal
To keep track of typical climate conditions and provide context for weather and climate forecasts, the World Meteorological Organization uses a set of data products known as climatological standard normals.
They define climate as averages of monthly, seasonal and annual weather-related variables such as temperature and rainfall, over consecutive 30-year periods.
Climate normals can be used to assess how typical of the current climate a particular event was in a given location. It’s how we arrive at temperature anomalies.
For example, to tell whether a year was relatively “hot” or “cool”, we look at the anomaly – the difference between the average temperature for the calendar year in question, compared to the climate normal.
But extreme variations are now occurring in periods of ten years or even shorter. Consequently, multiple increases and decreases can cancel each other out over a 30-year period. This would hide the large changes in statistics of weather variables within that period.
For example, large rainfall changes in average monthly, seasonal and annual amounts can be hidden within 30-year averages. Global warming often amplifies or diminishes the impacts of multiple climate driver phases within approximately ten-year periods. When averaged over 30 consecutive years, some information is lost.
What did we find?
Over the past decade or so, machine learning (where computers learn from past data to make inferences about the future) has become a powerful tool for detecting potential links between global warming and extreme weather events. This is referred to as attribution.
Machine learning techniques are simple to code and are well-suited to the highly repetitive task of searching through numerous combinations of observational data for possible triggers of severe weather events.
In our new study, machine learning helped us untangle the dominant climate drivers responsible for recent flash flood rainfall on the east coast of Australia, and a lack of rainfall on the southern coast.
Along the southern coast, the cool season from May to October is typically produced by mid-latitude westerly winds. In recent years these winds were farther away from the Australian continents, resulting in the recent drought of 2017–19 and flash drought of 2023–24.
In contrast, after the 2020–22 La Niña, the east coast continues to experience wetter conditions. These come from generally higher than average sea-surface temperatures off the east coast and Pacific Ocean, due to the presence of onshore winds.
Machine learning identified the dominant drivers of the scenario above: the El Niño-Southern Oscillation, the Southern Annular Mode, the Indian Ocean Dipole, and both local and global sea surface temperatures.
A key finding was the prominence of global warming as an attribute, both individually and in combination with other climate drivers. Climate drivers and their combinations can change with increasing global warming over shorter periods that contain extremes of climate. Hence, the use of 30-year periods as climate normals becomes less useful.
Finding regional attributes for better forecasting
Climate models often disagree on the climate drivers likely to be relevant to extreme events.
A key feature of machine learning is the ability to deal with multi-source data by identifying regional attributes. We can combine possible climate-driver predictors with high-resolution climate model predictions, especially after the climate model data are downsized to cover specific regions of concern. This can help with extreme event forecasting at a local scale.
Scientists are continuously developing new methods for applying machine learning to weather and climate prediction.
The scientific consensus is that global warming has dramatically increased the frequency of extreme rainfall and temperature events. However, the impacts are not uniform across the world, or even across Australia. Some regions have been more affected than others.
Currently there is no single alternative definition to the traditional 30-year climate normal, given the variable impacts across the planet. Each region will need to determine its own relevant climate time period definition – and machine learning tools can help.
The authors do not work for, consult, own shares in or receive funding from any company or organisation that would benefit from this article, and have disclosed no relevant affiliations beyond their academic appointment.
This article was originally published on The Conversation. Read the original article.


