
Aaron Glenn Names Jets' Official Starting QB for 2026 Season Before NFL Draft
The Jets are expected to draft a quarterback next month, but Glenn has already made up his mind about the team’s QB1.
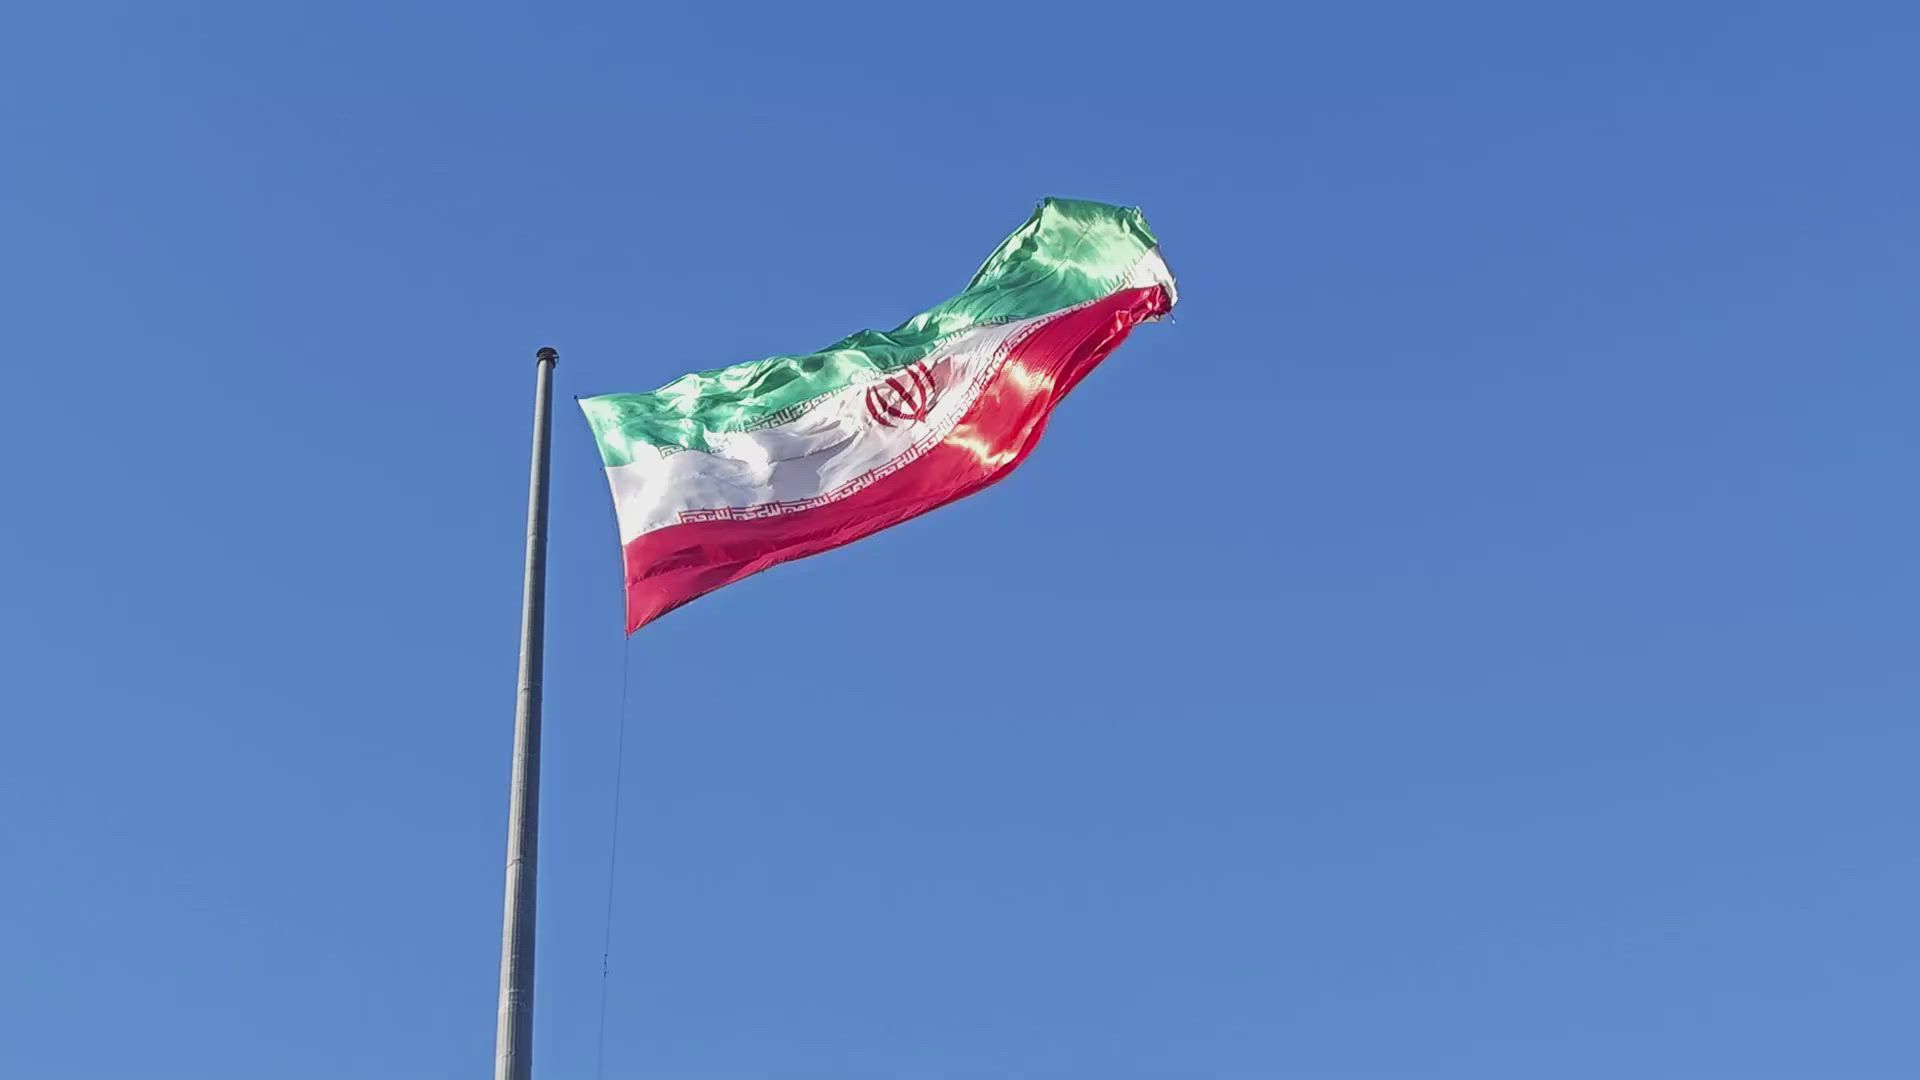
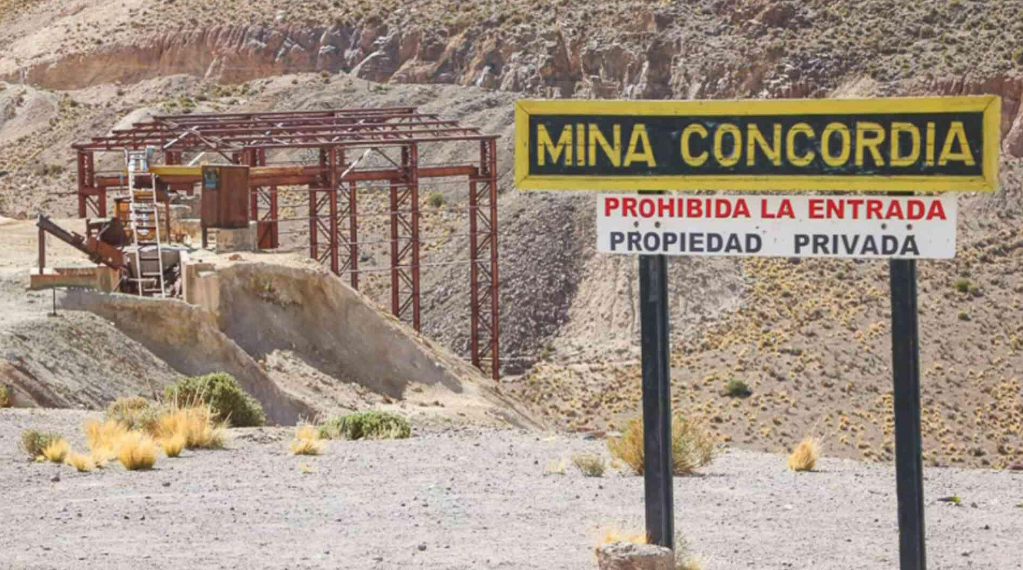
Indian worker killed in Iranian attack on Kuwait power, desalination plants

“A service building at a power and water desalination plant was attacked as part of the Iranian aggression against the State of Kuwait, resulting in the death of an Indian worker and significant material damage to the building,” ministry spokesperson Fatima Abbas Jawhar Hayat said. Amid rising tensions, Pakistan said…
Hundreds of titles - just one subscription!

On sale for a limited time only, get 25% off for the first 3 months.
'I'm going to text Joe': JD Vance fires back after Joe Rogan slams MAGA supporters as ‘unintelligent’ and ‘dorks’

JD Vance responded to Joe Rogan after the podcast host derided MAGA supporters as “dorks” and “unintelligent,” highlighting a widening rift with Donald Trump’s administration. Rogan, once supportive, now criticizes policies on Iran, immigration and the Epstein files. Vance downplayed the remarks, defended deportation efforts and insisted the administration remains…
Cory Booker says Democrats have ‘failed this moment’ and calls for new leaders

New Jersey senator also says party has ‘too small of a coalition’ as it seeks to confront ‘new challenges’
Justin Baldoni's Lawsuit Against Ex-Publicist to Proceed and Could Expose Messages: Is Blake Lively Involved?

Justin Baldoni won a court ruling allowing his defamation case against former publicist Stephanie Jones to proceed, which could reveal private messages involving Blake Lively and her team.
‘I Have to’—Christian Pulisic Makes Key Promise After Latest USMNT Setback

After a 5–2 loss to Belgium, the USMNT star vows to score soon.
Trump news at a glance: Generational divide over Iran war emerges at key conservative conference

Younger conservatives say they are disappointed by Donald Trump’s decision to launch war against Iran. Key US politics stories from 29 March
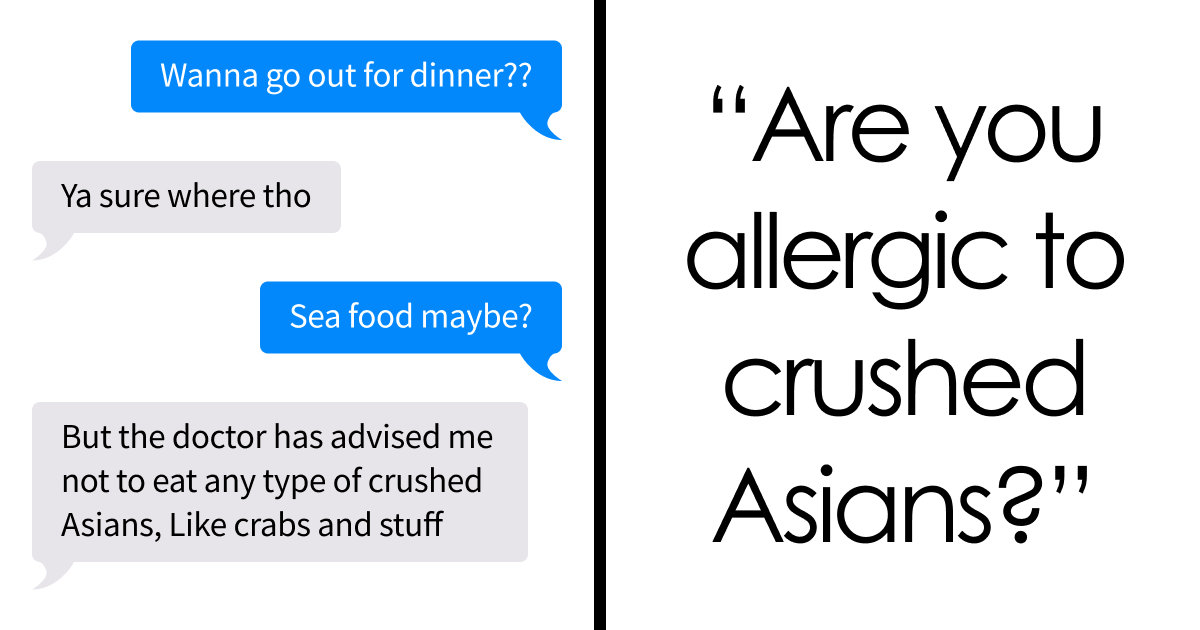
59 Times People Struggled With Words So Badly, They Cracked Others Up (New Pics)

When you receive a message like "The doctor has advised me not to eat any type of crushed Asians," you have two choices. One, you immediately think that the person has something against Asian folks. Second, you pity the poor soul and assume they were bamboozled by that pesky autocorrect.…
Ukraine war briefing: German defence giant sparks row after comparing Ukraine drone makers to ‘housewives’

Rheinmetall CEO’s dismissive comments draw pointed reaction from Ukrainian prime minister and adviser to Volodymyr Zelenskyy. What we know on day 1,496
A war without accountability: why the Middle East crisis is also a legal quagmire

What began with surprise US and Israeli strikes on Iran one month ago has hardened into a grinding stand-off, with no clear way out.

This simple Pilates exercise is worth six regular sit-ups. Here’s why I use it to work on my spinal mobility and deep core strength
Everything you need to know about the Pilates roll-up and how to do it.
Breakthrough Research Identifies Pig Semen Ingredient as Key to Eye Drops That Halt Spread of Cancer
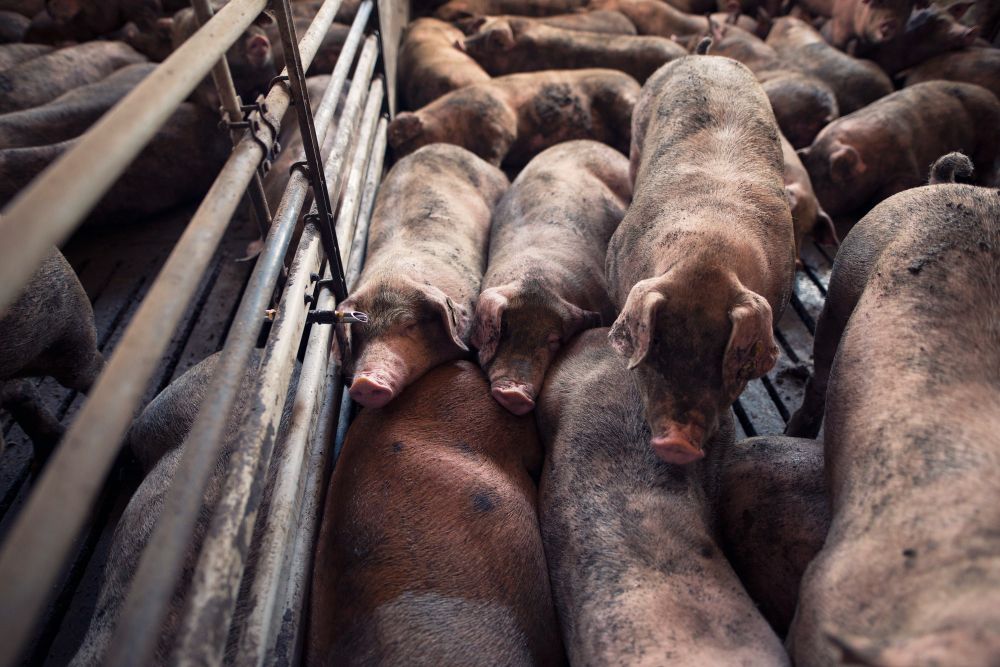
Scientists in China have developed eye drops from pig semen that halted tumor growth in mice, potentially offering a less invasive treatment for childhood eye cancer.
Hundreds of titles - just one subscription!
On sale for a limited time only, get 25% off for the first 3 months.
What You Should Do With a Magnolia Tree in April for Bigger, More Beautiful Flowers

April care tips to nurture your magnolia and enjoy its springtime blooms to the fullest
A Pilates instructor says these three standing moves are key for improving balance over 60

Reduce your risk of falls with these three simple moves
Korean Fried Chicken Tops Global Survey as Most Popular K-Food Worldwide in 2026, Survey Shows
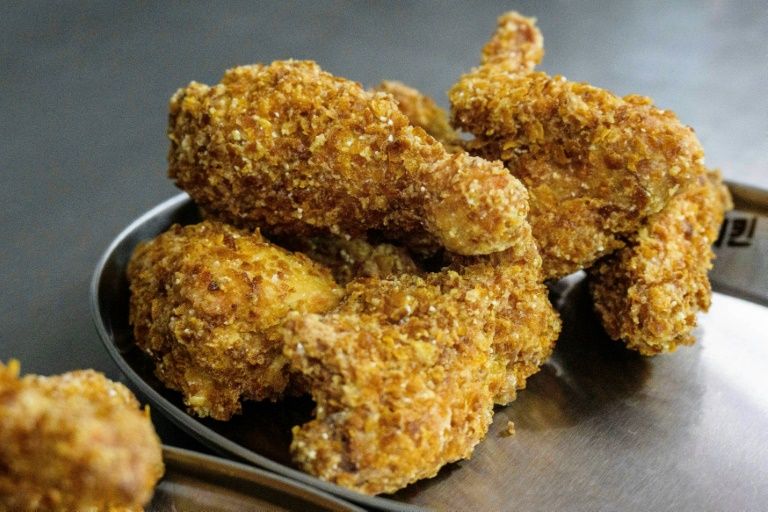
Korean fried chicken has solidified its position as the world's most popular Korean dish, according to a major 2025 overseas consumer survey released late last year, as the global boom in Hallyu continues to drive demand for bold flavors, fermented foods and interactive dining experiences into 2026.
Mechabellum is a conversation you should be having

Them's fighting words.
Robotics can improve musical timing between performers, new study shows

In the musical experiment, violinists wore lightweight robotic exoskeletons attached to their bow-playing arms, which delivered subtle changes to their natural movements.
This Summer Flower is the Only One You Need to Attract Bees – Plant it in April for a Pollinator-Packed Garden
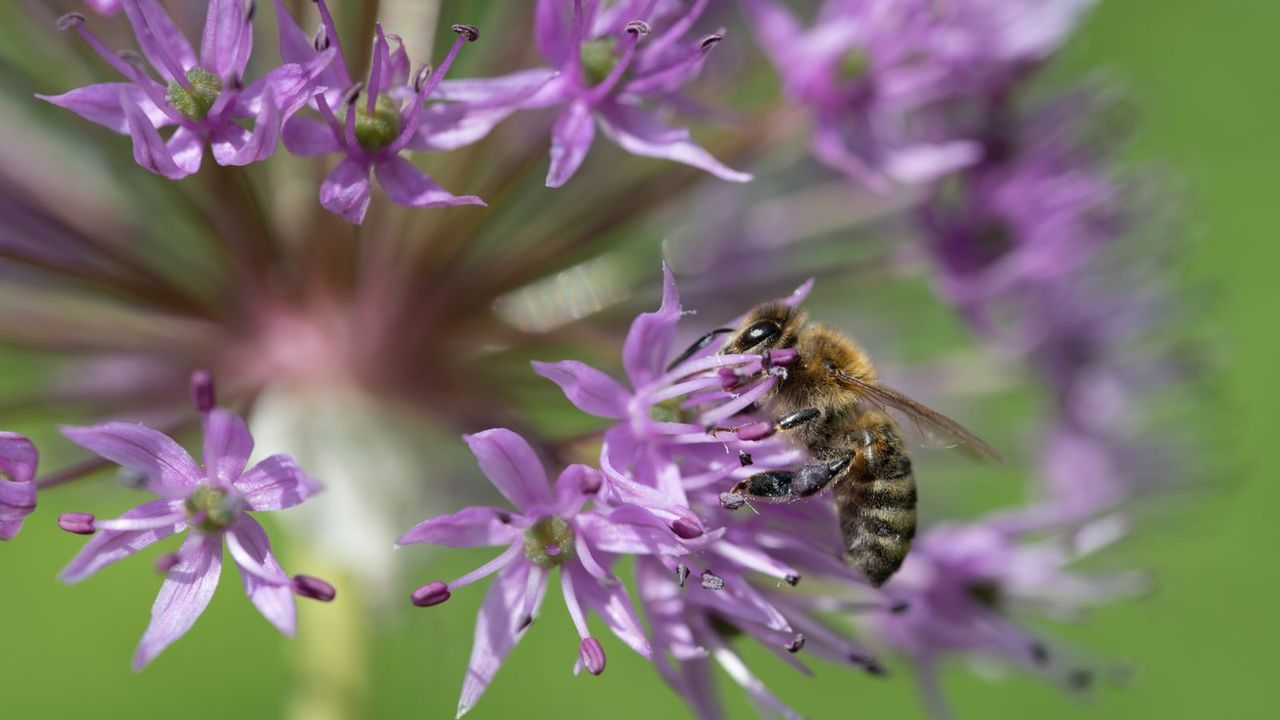
This reliable bulb will transform your yard into a pollinator haven this summer – and introduce a burst of color, too
Forget the 'six pack': Build glute stability to protect your lower back with these 3 Pilates moves

These three Pilates exercises build strong, stable glutes to help protect your lower back alongside your core.
What to do with a spider plant in April to stop brown tips and set it up for a season of healthy growth – it'll produce lots of spiderettes too

It'll produce lots of spiderettes too

Indian worker killed in Iranian attack on Kuwait power, desalination plants
“A service building at a power and water desalination plant was attacked as part of the Iranian aggression against the State of Kuwait, resulting in the death of an Indian worker and significant material damage to the building,” ministry spokesperson Fatima Abbas Jawhar Hayat said. Amid rising tensions, Pakistan said…
Cory Booker says Democrats have ‘failed this moment’ and calls for new leaders
New Jersey senator also says party has ‘too small of a coalition’ as it seeks to confront ‘new challenges’
Hundreds of titles - just one subscription!
On sale for a limited time only, get 25% off for the first 3 months.
‘I Have to’—Christian Pulisic Makes Key Promise After Latest USMNT Setback
After a 5–2 loss to Belgium, the USMNT star vows to score soon.
Nancy Guthrie Update: Police Address Rumours Linking Canal Body to Savannah's Mum
Authorities confirm no connection between a body found in a canal and the disappearance of 84-year-old Nancy Guthrie, despite public speculation.
Air Canada flight attendant ejected from seat during LaGuardia crash pictured in hospital as daughter describes horror injuries

Air Canada flight attendant Solange Tremblay suffered two shattered legs, a fractured spine, and severe skin damage in the crash
Dozens of No Kings protesters arrested in Los Angeles after clash with police
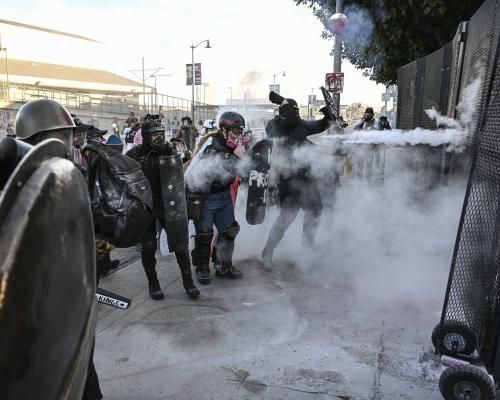
Officers fired pepper balls and teargas into group of about 150 on Saturday night, arresting those who did not disperse
Lawmakers react to reports Pentagon preparing for ground operations in Iran
Conflict shows signs of entering new, more dangerous phase as additional 3,500 US troops arrive in the Middle East
After 12 years, a USMNT loss to Belgium still carries a World Cup weight

The United States’ collapse in a 5-2 loss to Belgium made clear that the gap between the sides in 2014 has yet to narrow
'Complaints of palpitations': A day after arrest, Ex Nepal PM Oli admitted to hospital

NEW DELHI: Former Nepal Prime Minister KP Sharma Oli was admitted to a hospital a day after he was arrested in connection with a culpable homicide case linked to the alleged suppression of the September Gen Z protests.
Mauricio Pochettino’s Prematch Prediction Backfires Spectacularly in Record USMNT Loss

USMNT were thumped 5–2 by Belgium but Pochettino was still able to find some positives. He wasn’t the only one.

OpenAI is narrowing its focus on things that make money
OpenAI shelved or modified plans for erotica, video, and Instant Checkout.
Meta executives could earn nearly $1 billion each if they hit goals in pursuit of a $9 trillion valuation

Moonshot compensation was once reserved for CEOs. Not anymore.
Hundreds of titles - just one subscription!

On sale for a limited time only, get 25% off for the first 3 months.
Microsoft's new gaming boss axed 'This is an Xbox' campaign because 'it didn't feel like Xbox' — Xbox brand undergoes transformation to redefine its identity

The "This is an Xbox" marketing campaign was met with severe backlash from pretty much everyone outside Microsoft's top brass. Now, it seems like the brand is course-correcting with new Xbox chief Asha Sharma leading the charge for a rejuvenated Xbox, and personally killing the controversial campaign.
Donald Trump's Toyota Claim Faces Scrutiny After Saying 92-Year-Old 'Owner' Pledged $10 Billion Despite Death in 2023

Explore the discrepancies in Trump's claims about Toyota's US investment and the reality, as Toyota disputes the figures.
Time for a PC upgrade? Major study finds workplace devices are way behind on installing the latest updates — with Windows much worse than macOS

Enterprise devices lag in updates and stability, exposing Windows and Mac fleets to security gaps, workflow interruptions, and upgrade pressures.
Some major US airlines may ‘not survive’ unless oil prices come down soon, experts warn

Jet fuel prices have ‘more than doubled in the last three weeks,’ United Airlines’ CEO warned
Gold Price Gains: Bullion Rises To $4,550 Despite Turkey's 60-Ton Sell-Off Shock

Gold prices have clawed back above $4,500 an ounce, heading for their first weekly gain since the Iran war began, even as Turkey's central bank dumped 60 tonnes of bullion.
Sony to hike PS5 prices by $100 as AI and Iran war push up memory chip costs
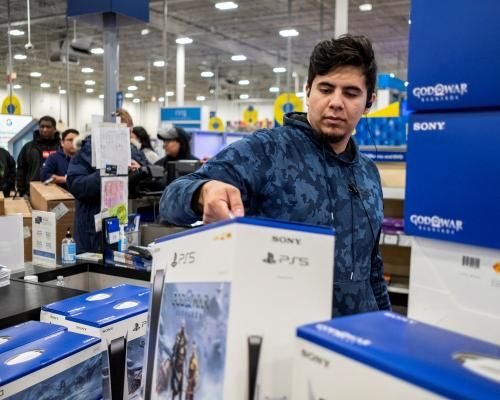
Updated prices of PlayStation 5 consoles to go into effect on 2 April as electronics makers face rising cost pressures
No § 230 Immunity for Meta's AI-Generated Ads
From Tuesday's decision by Chief Judge Richard Seeborg (N.D. Cal.) in Bouck v. Meta Platforms, Inc.: This case is the… The post No § 230 Immunity for Meta's AI-Generated Ads appeared first on Reason.com.
Macy's just launched an AI-powered shopping assistant. Customers who use it spend nearly 400% more

The “Ask Macy’s” chatbot may help the company’s comeback and reverse declining sales.

A war without accountability: why the Middle East crisis is also a legal quagmire
What began with surprise US and Israeli strikes on Iran one month ago has hardened into a grinding stand-off, with no clear way out.
Will China Bomb Taiwan Soon? Attack Drones Assembled Near Taiwan Strait, Report Says

China's conversion of warplanes into attack drones near Taiwan sparks concerns over potential conflict escalation. Satellite images reveal strategic positioning.
Hundreds of titles - just one subscription!
On sale for a limited time only, get 25% off for the first 3 months.
Women in the Pacific are increasingly subject to digital abuse: new research
Gender-based violence is a global issue, but studies consistently show the Pacific has among the highest rates in the world. Up to 79% of women in the region experience some form of abuse over the course of their lives.
Why do men sexually harass women at work? Science offers two explanations – but only one of them holds up

What causes workplace sexual harassment? How can we continue to better understand it? And what can be done to prevent it?
‘I don’t need any approvals’: 61 percent of Americans hate Trump’s war, but he still thinks asking Congress is beneath him

It is wordplay now, what will it be tomorrow?
I'd made five tracks in 25 years, but after I was prescribed medical cannabis, I made an entire album in six months. So, what’s going on?
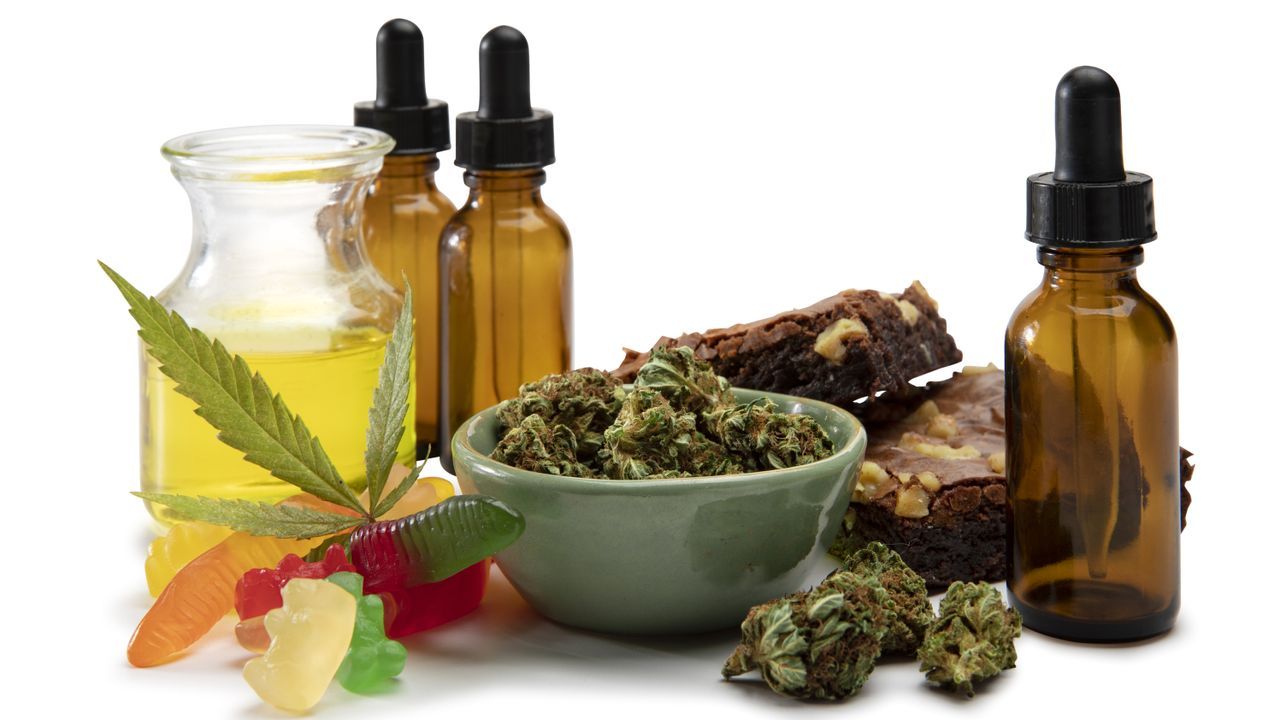
Let’s get into the weeds
The Guardian view on peptides: Robert F Kennedy Jr would leave public health policy to the hucksters

Editorial: The US health secretary says he is a big fan of peptides. Many are promising drugs, but the only way to know their utility is proper clinical trials
Young MAGA Men Turn on Trump, Say 'He's Lied About Everything' and Broke His Promises Over Iran War

Young MAGA supporters, mostly men, expressed anger at President Trump, accusing him of breaking campaign promises by joining military operations in Iran.
Iran's 'Game Changer' Missile Strike On Diego Garcia Puts Europe In Range

Iran's attempted missile strike on the US–UK base at Diego Garcia has convinced many analysts that Tehran's self‑declared range limits are over, bringing most of Europe within potential reach.
How do Israel and Iran’s nuclear status differ under international law?

At a time when military tensions in the Middle East have further intensified in recent weeks, in the context of operations conducted by the United States and Israel and renewed concerns surrounding Iran’s nuclear programme, a recurring question has re-emerged in public debate: why does Israel possess nuclear weapons while…
59 Times People Struggled With Words So Badly, They Cracked Others Up (New Pics)
When you receive a message like "The doctor has advised me not to eat any type of crushed Asians," you have two choices. One, you immediately think that the person has something against Asian folks. Second, you pity the poor soul and assume they were bamboozled by that pesky autocorrect.…
People Are Sharing Examples Of Pointless Gendering, And Here Are The 53 Most Infuriating Ones (New Pics)
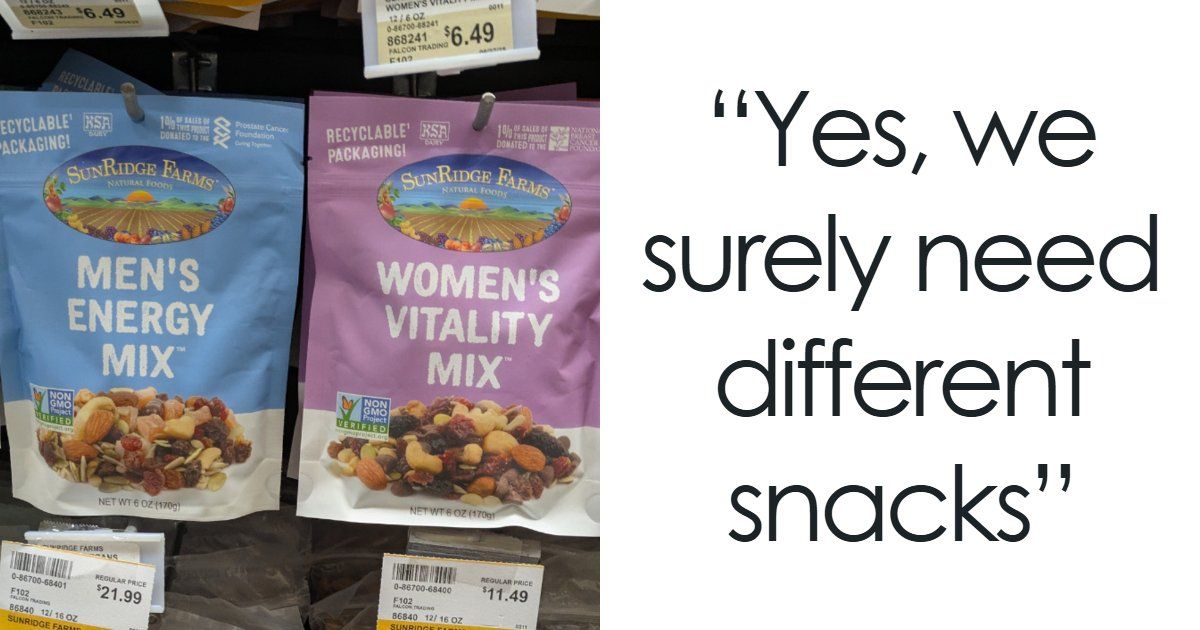
The world of gendered products has gone from mildly amusing to completely ridiculous. They show up almost everywhere — from baby bottles priced differently based on color to earplugs marketed as “sleep pretty” versus “extreme protection” for women and men. At this point, even something as harmless as macarons hasn’t…
Hundreds of titles - just one subscription!
On sale for a limited time only, get 25% off for the first 3 months.
David Alan Grier Admits He Auditioned For Seinfeld And Instantly Thought It Was Going To Fail: 'The Bag Was Fumbled'

He would have been a very difference choice for the role.
A Ridiculous VIP Pasta-Making Experience WWE Is Selling Is Going Viral

Pull our your ATM card.
Fans Have Been Roasting The Rock’s Moana Look, But The ‘Pounds Of Hair’ It Took To Achieve It Don't Sound Fun

This is quite a look.
The Season 1 Finale Of HBO's Neighbors Is Must-Watch Television For One Big Reason
Stop what you're doing and watch it.
‘I’m trying to de-escalate. He has a needle in my arm’: Southern California woman goes to tattoo shop. Then the owner asks her something shocking

A woman has sparked discussion online after she called out her tattoo artist for his inappropriate behavior once he learned she was recently single.
Forget birdwatching, I’m into moth-watching: they’re fascinating and misunderstood insects

According to new research, distinguishing between the UK’s 2,500 species could halt cognitive decline – so my brain could not be happier, or healthier, says science writer Helen Pilcher
I tried HigherDose’s $1,400 PEMF mat to help me relax. I got weird dreams and disappointment
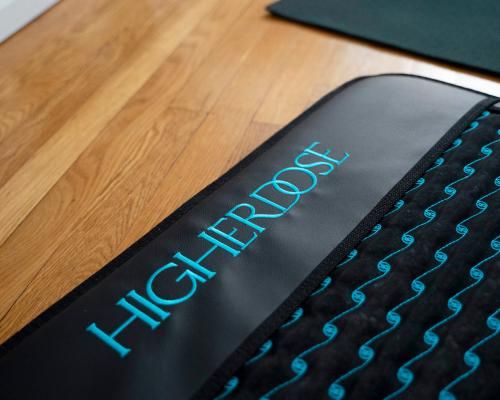
This pricey infrared therapy mat claims to help mood, sleep and muscle recovery. It felt more like a glorified heating pad
Florida judge asked if Black defendant had ever ‘chopped cotton’ as he mulled community service sentence, report says
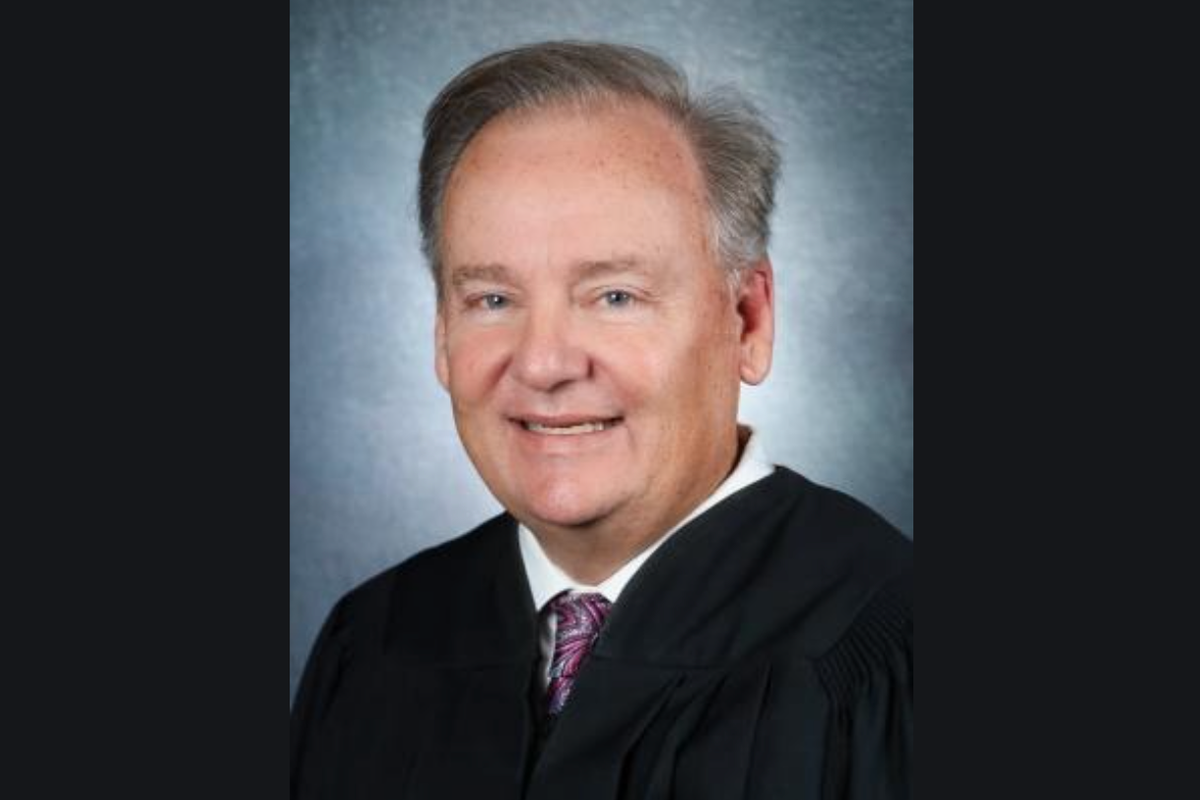
The judge acknowledged his remarks were ‘ill-considered,’ court documents state

New Water Buoy Barriers in Texas Could Disrupt Rio Grande in 'Unpredictable, Damaging, Catastrophic' Ways, Experts Say
Experts consulted about the barriers said they could speed up floodwater in a region already prone to flooding, as well as accumulate sediment and create new landforms along the river.
‘They made fun of us’: Meet the residents who won’t let Bonaire sink without a fight

Faced with the devastating wrath of climate change, these islanders have put up a victorious fight – and they’re not done yet.
Hundreds of titles - just one subscription!
On sale for a limited time only, get 25% off for the first 3 months.
How to catch the full 'Pink Moon' in April followed by a 'Blue Moon' in May

April's full moon, known as the Pink Moon, determines the dates of Passover and Easter. This year, it rises on April 1.
Is foraging really feasible to feed myself?

This labor-intensive way of eating isn’t for everyone – and I’m not sure it’s for me. It requires planning and flexibility
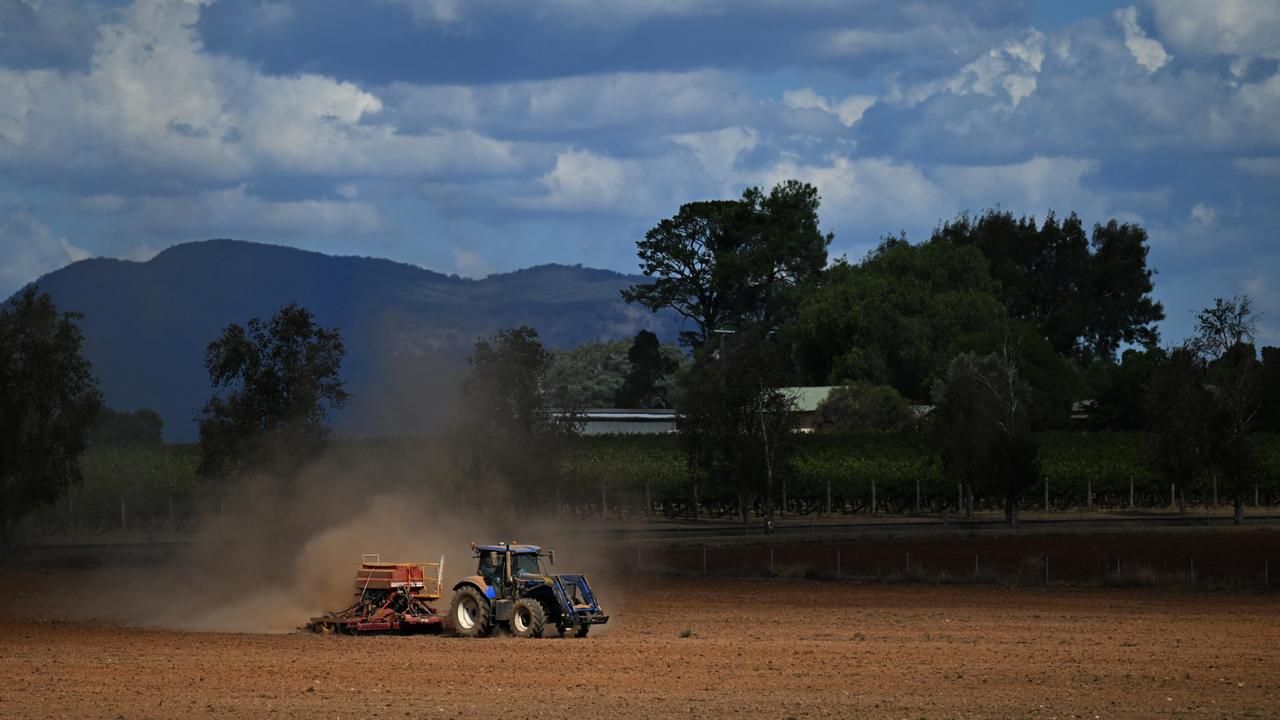
Europe's farms are reeling from the Iran war. Regenerative farmers saw it coming
The Iran war has sent fertiliser prices soaring – but these farmers aren’t fazed.
A painful ‘eye biting’ fly is invading part of Southern California
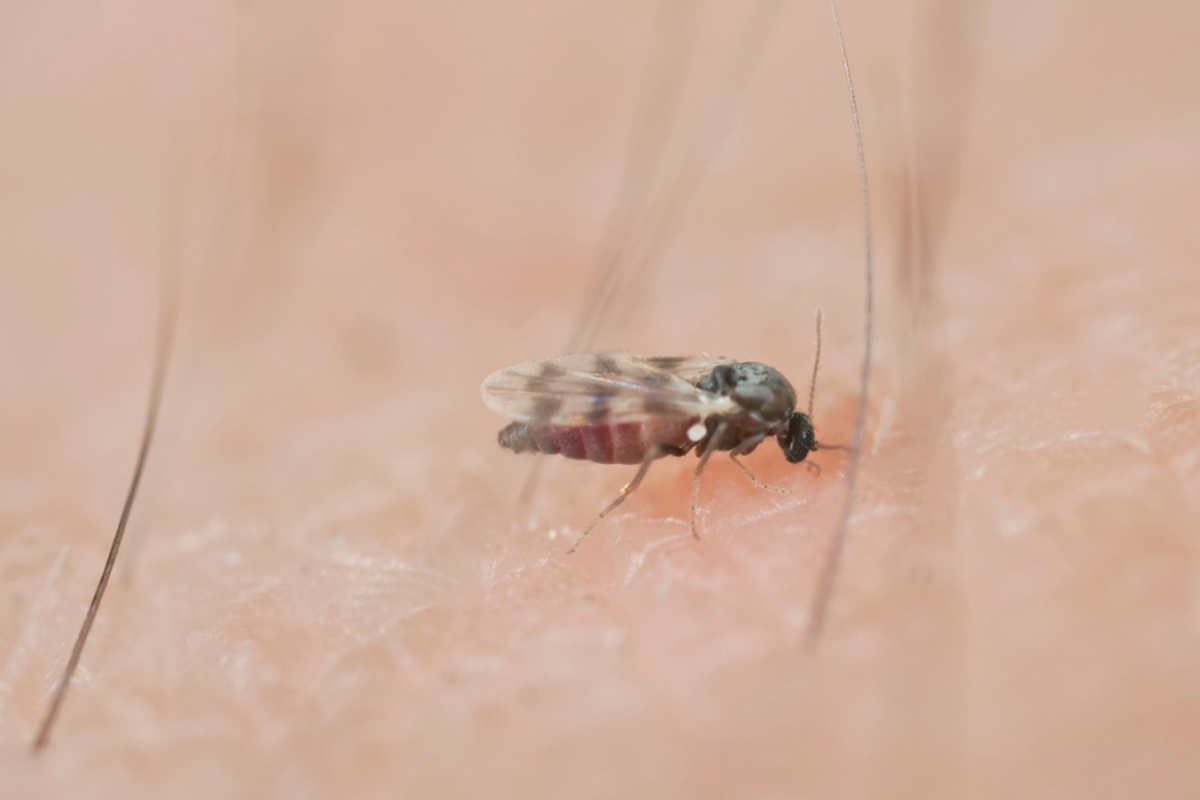
Black fly populations are appearing in higher numbers than usual for the season
AI's arrival complicates Big Tech climate goals, and some worry it's locking in more fossil fuels

Tech companies set ambitious climate goals at the start of the decade, promising to slash emissoins that contribute to global warming
Snow and stormy winds close schools and roads, and cut power in some Balkan countries
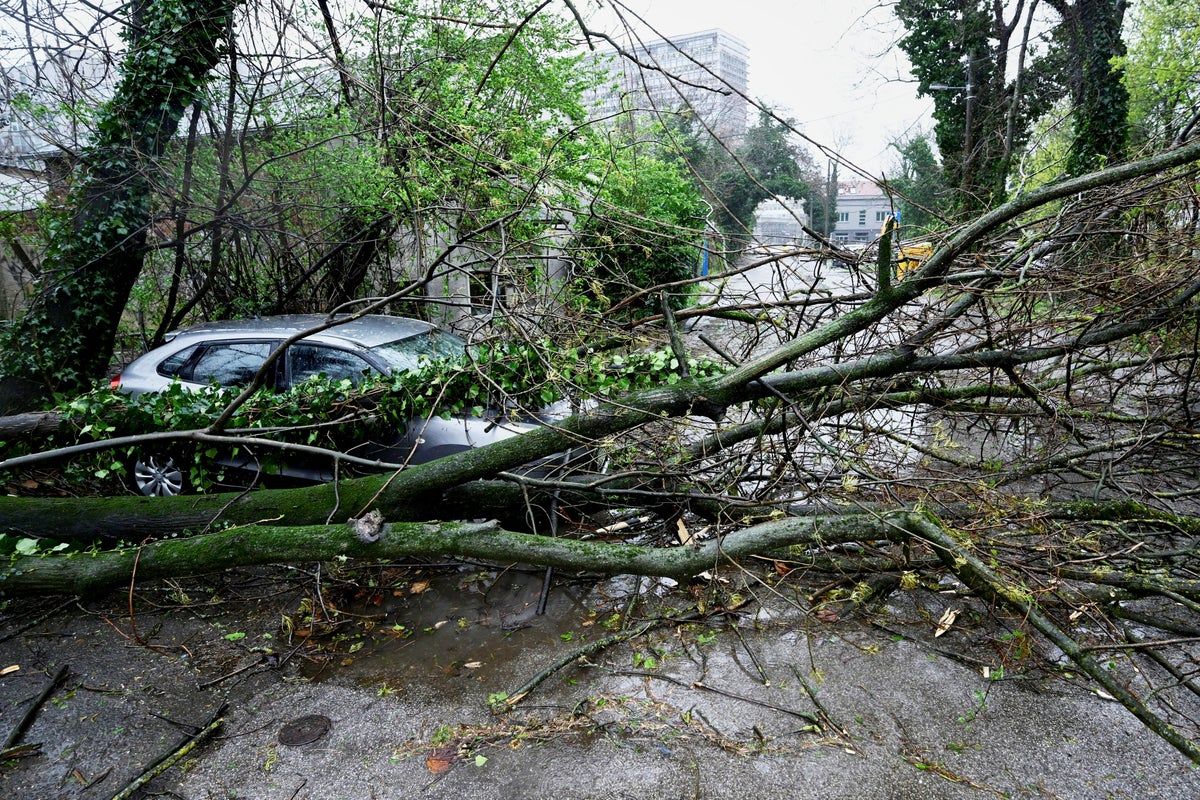
Stormy winds, rain and snow have closed schools and left thousands of people without electricity in some Balkan countries while snarling traffic throughout the region and pulling out trees and ripping off rooftops
Drought is fuelling antibiotic resistance worldwide, study finds
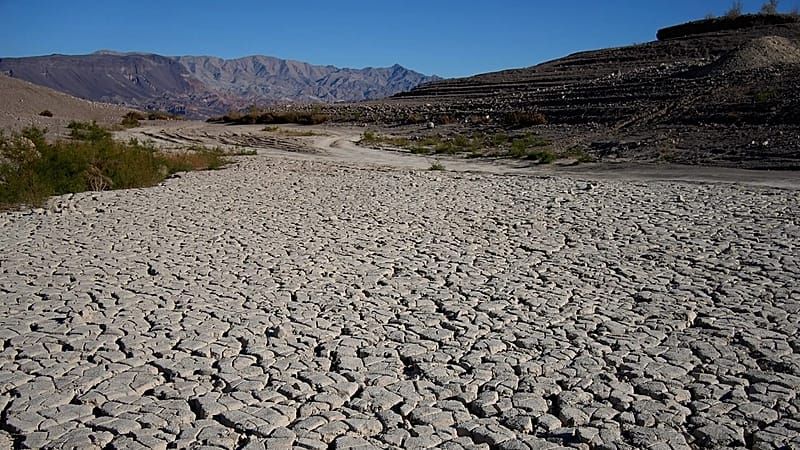
Drought concentrates antibiotic-resistant microorganisms in soil, raising concerns about the impact of climate change on public health, according to a new study.
Share prices, sports results … CO₂ levels? The case for reporting climate stats every day

In today’s CO₂ news, global atmospheric carbon is at 429.46 parts per million. That’s one point lower than yesterday and 79 above the recommended planetary boundary.
Top Iranian Official Says Tehran Will Seek To Control The Strait Of Hormuz As a Result Of The War: 'No Longer Be As In The Past'
Iranian Vice Preisdent Mohamed Reza Aref said Theran will seek to control the Strait of Hormuz as a result of the ongoing war.
Iran Launches 'Sacrificing Life' Campaign To Recruit Volunteers To Counter Potential U.S. Ground Operation

Iran launched what it described a "Janfada," or "Sacrificing Life" campaign to recruit volunteers to fight a potential ground operation by U.S. forces.
Hundreds of titles - just one subscription!
On sale for a limited time only, get 25% off for the first 3 months.
One Of The Ships Carrying Russian Oil In The Atlantic Arrived In Venezuela Rather Than Cuba

One of two ships carrying Russian oil that appeared to be heading to Cuba arrived in Venezuelan waters, according to a new report.
Asian shares decline as oil prices soar amid the war in Iran, echoing last week's Wall Street drop
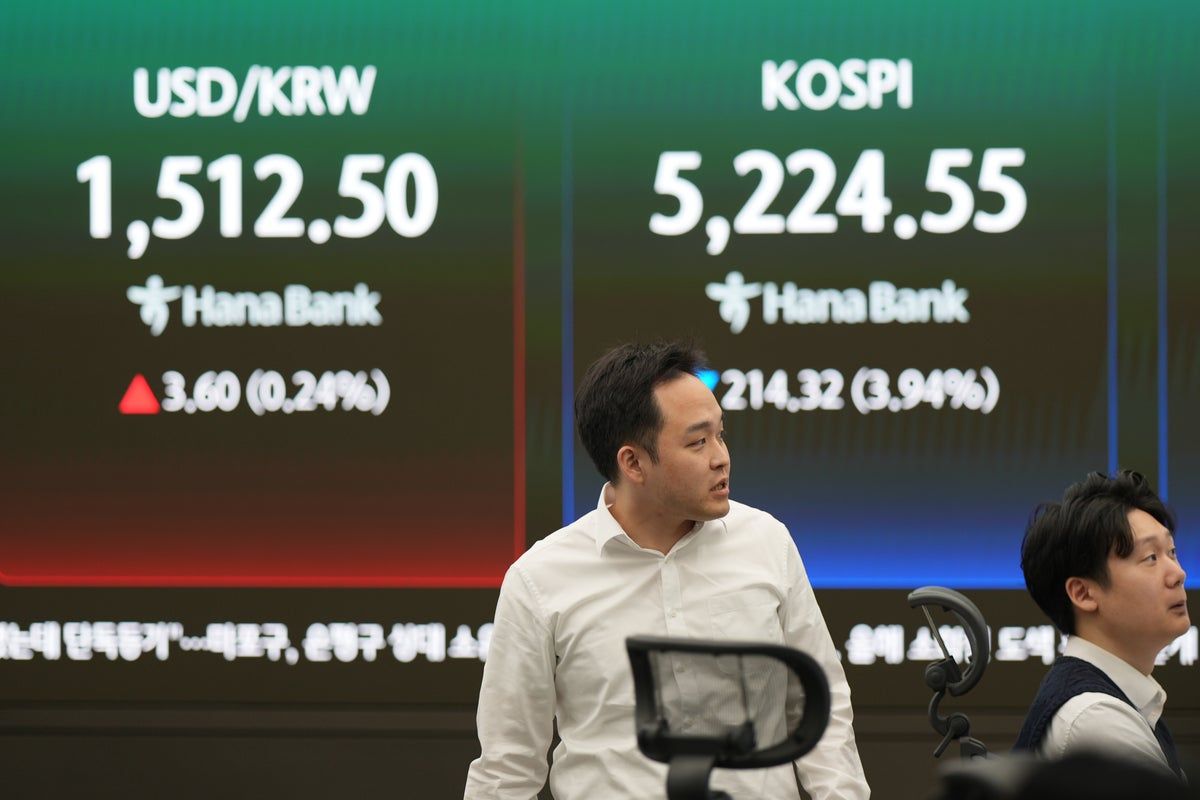
Asian shares are mostly declining, as worries continue about soaring oil prices and the potential for further escalation in the U.S. war with Iran
Victorian Liberal who defeated Moira Deeming to be dumped by party over character reference for sex offender

Dinesh Gourisetty has been called a ‘pedophile supporter’ for providing court reference for a friend convicted of sexually assaulting a child
Two of Australia’s largest sources of jet fuel could be cut off as South Korea and China eye restrictions

South Korea’s transport ministry says domestic airlines have asked authorities to redirect export-bound jet fuel back to the local market
What we know so far about the shooting of fugitive Desmond ‘Dezi’ Freeman

Police shot dead a man on Monday, in an operation police said ended their seven-month search for the 59-year-old who has been on the run since allegedly killing two police officers in Porepunkah
Who is Dezi Freeman and what did he do? What to know about the Australian fugitive shot dead by Victoria police

56-year-old ‘sovereign citizen’ had been on the run after allegedly killing two police officers at Porepunkah in Australian alpine region in August
Differing accounts in case against AFL champions

More alleged suspects have been interviewed as police prosecute two AFL premiership stars over a wild brawl outside a pub.
Ex-AFL player faces jail time after guilty verdict

A former footballer has been taken into custody after a jury convicted him of ripping off families with his pool business, following four trials for the matter.

No tuition, no grades, no power grid: why are people flocking to a ‘college’ in the middle of the desert?
Two hundred miles from LA, an off-grid community with roots in Burning Man offers an unorthodox educational experience – is Mars College the future?
Kharg of the US brigade: Pentagon lines up troops to capture Iranian island that accounts for 90 per cent of its oil exports

The TOI correspondent from Washington: What began as a “little excursion” into Iran – as described by President Trump –- is now edging toward a full-scale invasion of the country, with U.S officials signaling the start of a broader military campaign, including the potential seizure of Kharg Island—Tehran’s most critical…
Hundreds of titles - just one subscription!
On sale for a limited time only, get 25% off for the first 3 months.
F-16 Fighter Jets Deploy Flares to Warn Rogue Pilot Near President Trump's Mar-a-Lago

A civilian plane breached restricted airspace near Mar-a-Lago, prompting a swift military response with fighter jets deploying flares.
Korean Fried Chicken Tops Global Survey as Most Popular K-Food Worldwide in 2026, Survey Shows
Korean fried chicken has solidified its position as the world's most popular Korean dish, according to a major 2025 overseas consumer survey released late last year, as the global boom in Hallyu continues to drive demand for bold flavors, fermented foods and interactive dining experiences into 2026.
Mexican Cartels Are Increasingly Targeting Workers for Recruitment, Expert Says
Dr. Víctor Sánchez said criminal groups have long viewed extortion as a steady source of income, and the kidnapping of employees often creates pressure on companies to pay so-called protection fees.
FBI responds after American Airlines flight forced to divert due to ‘disruptive passenger,’ report says

The FBI determined there was no threat to the public after searching the plane
'US could take the oil in Iran': Trump signals seizure of Kharg Island export hub

His remarks come at a time when the US-Israel war with Iran has pushed the region deeper into crisis and driven a sharp surge in global oil prices. Brent crude climbed above $116 per barrel on Monday in Asian trading, nearing its highest level since the conflict began. Trump said:…
Dozens of No Kings protesters arrested in Los Angeles after clash with police
Officers fired pepper balls and teargas into group of about 150 on Saturday night, arresting those who did not disperse
‘It’s biblical’: Maga anxiety over Iran war on display at CPAC as Trump skips event

Attendees at Conservative Political Action Conference express support and concerns amid rift over Trump’s action
Indian worker killed in Iranian attack on Kuwait power, desalination plants
“A service building at a power and water desalination plant was attacked as part of the Iranian aggression against the State of Kuwait, resulting in the death of an Indian worker and significant material damage to the building,” ministry spokesperson Fatima Abbas Jawhar Hayat said. Amid rising tensions, Pakistan said…

Second Amendment Roundup: The Citizenship Clause Implicates the Second Amendment.
Aliens here unlawfully or on a nonimmigrant visa are prohibited from possession of firearms.
Florida Mayor Claims ICE Driving Detainees 'Around Town' to Restart Jail Time Limits'

Orange County Mayor Jerry Demings and immigration attorneys say federal authorities have been transporting detained migrants "around town" before rebooking them into local jails the same day to restart a three-day detention limit.
Hundreds of titles - just one subscription!
On sale for a limited time only, get 25% off for the first 3 months.
Some Dems' 2028 strategy: a straight, white, Christian man
Some top Dems fret that parts of the electorate won't support a woman or non-white man for president.
Steve Bannon Says If Trump Is To Escalate In Iran, U.S. Should Go For 'Total War'

Former White House adviser Steve Bannon said that if Trump is to escalate hostilities in Iran, the U.S. should go for "total war" to achieve all military objectives.
L.A. Self-Defense Groups Hit the Streets to Track Agent Activity And Counter ICE Raids

A large number of organizations and volunteers in Los Angeles have formed self-defense groups to protect and inform migrants about the presence of immigration agents operating out of the city's industrial zone.
40% of U.S. Counties Lost Population Last Year as Immigration Crackdown Intensified: Report
About 40% of U.S. counties lost population between July 2024 and July 2025, as a sharp decline in immigration slowed national growth and reversed gains in many regions, according to new Census Bureau data.
Venezuelan Mother of Two Faces Deportation Months After Being Arrested at Monthly ICE Check-In
Her lawyers argue that by detaining her, the Trump administration violated the "intent and purpose" of the Trafficking Victims Protection Act, which protects trafficking victims, including noncitizens, regardless of immigration status.
DeSantis Hints at Another White House Run, But a Poll Shows Him Far Behind Leading Contenders

An Emerson College survey of Republican voters in New Hampshire released found him with just 5% support, lagging behind JD Vance and Marco Rubio
ICE Crackdown in Minneapolis Undermined Trust in Local Police and Cost $200M in Wages, Study Finds

The large-scale immigration enforcement operation in Minneapolis significantly eroded public trust in law enforcement and caused widespread economic disruption, according to new research.
Online 'Rape Academy' Exposed: Telegram Group 'ZZZ' Teach Men How to Commit Sexual Assault

A Telegram group named 'ZZZ' has been exposed for sharing tips on sexual assault and uploading videos of victims. An investigation is underway.

Trump is contemplating the sheer folly of boots on the ground in Iran. How did it come to this?
After the anguish of Iraq and Afghanistan, it’s almost unthinkable the US would again send troops to the Middle East – but its president is desperate and narcissistic, says foreign affairs commentator Simon Tisdall
Protesters dumped a Columbus statue in 2020. Trump installed a replica near the White House
The statue isn’t about preserving history – it’s about asserting the power to rewrite it
Hundreds of titles - just one subscription!
On sale for a limited time only, get 25% off for the first 3 months.
The US has opened up Pandora’s box in the Middle East, and possibly only Iran will benefit

THE INDEPENDENT VIEW: Editorial: With the Houthis controlling the Red Sea – and Iran the Strait of Hormuz – the global economy would be facing disaster
The Guardian view on Myanmar’s forgotten war: the military cosplay democracy but people demand the real thing

Editorial: Five years of brutal conflict have made the army more determined to crush opposition, and others more convinced they must resist
The Guardian view on peptides: Robert F Kennedy Jr would leave public health policy to the hucksters
Editorial: The US health secretary says he is a big fan of peptides. Many are promising drugs, but the only way to know their utility is proper clinical trials
Ian Rankin wishes he’d been there more for his kids? OK, but others wish they’d been there less

Rich or poor, male or female, it’s always a struggle to balance work and family, writes Emma Beddington. We’re all wondering about the paths we didn’t take
Forget birdwatching, I’m into moth-watching: they’re fascinating and misunderstood insects
According to new research, distinguishing between the UK’s 2,500 species could halt cognitive decline – so my brain could not be happier, or healthier, says science writer Helen Pilcher
A new Austen drama made me wonder: is the fate of bookish young women really so different today?

The Other Bennet Sister reminded me of my own self-consciousness – and worry that girls still have to play down their cleverness, says Guardian columnist Rhiannon Lucy Cosslett
Faithful, sensitive, forgiving: overthinkers like me make the best partners

Yes, we stay awake all night, worrying about things that everyone else has already forgotten. But at least we’re making an effort
Keir Starmer is right to defy Donald Trump over the Iran war

THE INDEPENDENT VIEW: Editorial: An exclusive poll for The Independent shows British people think better of the prime minister for staying out of the Iran war as much as possible
'Avatar Legends: The Fighting Game' Unveils Arcade-Style Fighter Style, Now Available for Preorder
Avatar Legends: The Fighting Game will give fans their long-requested video game experience in the franchise.
3 Years Later, An Iconic Director's Latest Masterpiece Just Got A Huge Upgrade

'Killers of the Flower Moon' proved that Martin Scorsese is only getting better. And now it's been cemented in its 4K Criterion release.
Hundreds of titles - just one subscription!
On sale for a limited time only, get 25% off for the first 3 months.
59 Times People Struggled With Words So Badly, They Cracked Others Up (New Pics)
When you receive a message like "The doctor has advised me not to eat any type of crushed Asians," you have two choices. One, you immediately think that the person has something against Asian folks. Second, you pity the poor soul and assume they were bamboozled by that pesky autocorrect.…
Did Erika Kirk Sue Druski? What We Know About the Cease-and-Desist Claim Over His Viral Skit

Explore the truth behind the viral rumors of Erika Kirk suing comedian Druski over a controversial skit. Discover how misinformation spread online.
Could The Most Mysterious Sci-Fi Thriller Of The Year Actually Be A Secret 'Cloverfield' Movie?

A vague but intriguing trailer has fans wondering if a standalone movie could actually be the next installment of a franchise.
‘Just extraordinary’: inside Babies, the beautiful drama about the terror and cruelty of miscarriage

Stefan Golaszewski, the creator of beloved sitcoms Him & Her and Mum, didn’t just draw from his own experience to write about baby loss – he also composed and performed the theme tune
Bethesda Shares Update on 'The Elder Scrolls 6' Development, Release After Eight Years

Bethesda has shared a much-awaited update on The Elder Scrolls 6's development and release plans after eight long years.
Aimee Lou Wood on The White Lotus, the Beatles biopic and stepping out of her comfort zone: 'The moment you play it safe, you’re done'

The White Lotus made her a global breakout. Now, as she steps into the world of the Beatles and Jane Eyre, Aimee Lou Wood is embracing risk — and learning when not to trust fate
85 Years Ago, A Forgotten Sci-Fi Thriller Introduced A Horror Icon

Without 'Man-Made Monster,' Lon Chaney Jr. of 'The Wolf Man' fame may never have become a Universal Monsters icon.
Fill that Glasto-shaped hole! The 40 best UK festivals you can still book

Who needs Worthy Farm? From woodland raves and psych freakouts to fell walks and barbecue hoedowns, there’s a festival for everyone this summer. And some of them don’t even require a tent

10 Affordable Handbags That Pass for Designer: Must-See Designer Dupe Bags
Upgrade your wardrobe with designer dupe bags and affordable handbags that combine style and value.
‘I thought, what the hell have I done?’: the people who moved abroad for love – and regretted it
Emigrating to be with your partner sounds wildly romantic, but what happens when the person is right and the place very much isn’t?
Hundreds of titles - just one subscription!
On sale for a limited time only, get 25% off for the first 3 months.
Master the Sheer Fashion Trend with Simple Sheer Outfit Ideas That Work for Any Occasion

Looking for inspiration? Try these sheer outfit ideas and learn how to style the sheer fashion trend.
Taylor Swift's Style at iHeartRadio 2026 Proves Sequins Rule Celebrity Red Carpet Fashion

Taylor Swift style takes center stage at iHeartRadio 2026. See her best celebrity red carpet fashion moments over the years.
How to make Easter chocolate nests – recipe

These fun, charming little treats are easy and quick to put together – and make for a great Easter activity with kids
Victoria Beckham's Pastel Moment: A Rare Look Leading Celebrity Spring Fashion Style Trends

Victoria Beckham embraces pastel trends in a rare look, redefining celebrity spring fashion style with a slinky negligee.
Skip Sandals: J.Lo's Celebrity Street Style Shoe Trend With Pencil Skirts for Spring Trends 2026

J.Lo swaps sandals for mesh flats in a celebrity street style look defining spring trends 2026. See how to wear it.
The kindness of strangers: An online forum user shipped me a car radiator, saving me from financial ruin

Other commenters helped me diagnose the problem. When I couldn’t afford the solution, someone I knew only by his handle offered to pay
Capsule Wardrobe Guide: Affordable Minimalist Fashion Shopping Tips to Build a Closet That Works

Build a functional wardrobe with this capsule wardrobe guide and minimalist fashion shopping tips for everyday style.
Luxury vs Fast Fashion: Which Wins in Clothing Quality Comparison and Value?

A clothing quality comparison of luxury vs fast fashion across durability, cost per wear, and resale value reveals which side actually wins on value.

What the GLP-1 era means for body positivity
"Real people's bodies aren't a trend," one advocate tells Axios.
Large proportion of diabetics may have undiagnosed heart failure, study suggests

Research involving 700 patients was led by the University of Glasgow.
Hundreds of titles - just one subscription!
On sale for a limited time only, get 25% off for the first 3 months.
Post-Workout Muscle Recovery Guide: Foam Rolling, Nutrition & Sleep for Faster Gains

Muscle recovery methods for DOMS relief using foam rolling, active recovery, nutrition, and sleep cycles to boost performance and reduce soreness.
Large proportion of diabetics may have undiagnosed heart failure, study finds

The study, which began more than three years ago, involved more than 700 people with diabetes
Social media blamed as number of people seeking help for body dysmorphia surges
Symptoms include obsessing over a specific area of the body
Landmark tumour mapping research could boost targeted breast and ovarian cancer therapies

The researchers said the findings indicate many more patients may benefit from precision therapies
How even sprinting for a bus could help slash risk of major diseases

The NHS recommends that adults should do at least 150 minutes of moderate exercise a week
‘I’ve had six barbaric operations for endometriosis – there needs to be a better way to diagnose it’

Despite endometriosis affecting about one in 10 women in the UK, it takes an average of eight years to get a diagnosis
I’ve been meditating for over 10 years—if I were starting again, this is what I’d do differently

Honest advice for beginners and regulars alike
The 'horrific' disease hitting regional Aussies hardest
Exposure to pesticides and other environmental factors could be behind far higher rates of motor-neurone disease in regional areas, experts warn.

Braylon Mullins’s Miracle Caps UConn’s Unbelievable Comeback to Earn Final Four Berth
In a weekend steeped in history, the Huskies marched from 19 points down to create an NCAA tournament masterpiece.
UCLA Returns to the Final Four With a More Confident Lauren Betts Leading the Way

The Bruins had a shaky start to their Elite Eight win over Duke, but their star center has learned how to step up as a game-changing presence when things get tough.
Hundreds of titles - just one subscription!
On sale for a limited time only, get 25% off for the first 3 months.
Who Is Braylon Mullins, the Three-Point Hero Behind UConn’s Game-Winner vs. Duke?

Meet newly minted Storrs royalty.
You Have to See Ducati's Insane Superleggera V4 Centenario To Believe It

Carbon ceramic brakes, carbon frame and bodywork, carbon swingarm, 247 horsepower, limited production, and a celebration of the brand's 100th birthday makes Ducati's Superleggera V4 Centenario the most extreme road-legal Ducati ever.
Bugatti's Last W16 Hypercar Gets A Touching One-Off Tribute

The Bugatti W16 Mistral marks the end of an era—the legendary W16 engine—and does so with one of the most extreme and finely executed interpretations ever produced. In the “Caroline” specification, the open-top roadster becomes something beyond pure engineering: a bespoke commission where technology and craftsmanship blend to the point…
Three Reasons Why UConn’s Thrilling Elite Eight Victory Over Duke Defied Logic, and One Reason Why It Didn’t

UConn’s stunning win over Duke came with the Huskies losing most of the stats that mattered.
NFL to Begin Hiring Replacement Officials As Referee CBA Nears Expiration
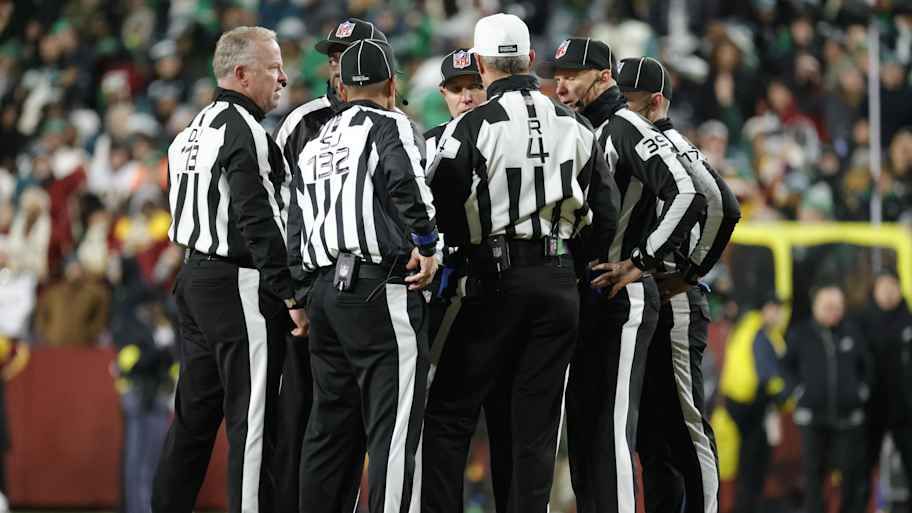
The labor deal between the NFL and NFLRA is set to expire on May 31.
Ex-FIA vice-president and WRC figure Morrie Chandler dies aged 85

New Zealander helped shape the championship’s global presence across a five-decade career
Dusty May Turned Michigan Into a Juggernaut Faster Than Anyone Expected

The Wolverines’ hire of May will likely reshape college basketball for a generation after he turned an eight-win team into a Final Four contender.
Hannah Hidalgo Puts Geno Auriemma on Notice After Notre Dame's Dance Ends With UConn

The Notre Dame junior is ready to handle the Huskies next year.

The Kia EV5 Is The Boxier, Cheaper Alternative To The EV6. With One Catch.
The made-in-China EV is cheaper and looks more like a conventionally SUV. But it doesn't have all of the EV6's advantages.
2027 Chevy Bolt EV 75 MPH Highway Range Test. Here’s How America's Cheapest EV Performs.

The new Bolt EV is EPA-rated for 262 miles. But you won't get that at highway speeds.
Hundreds of titles - just one subscription!
On sale for a limited time only, get 25% off for the first 3 months.
Everyone's worried that AI's newest models are a hacker's dream weapon
Anthropic fears its unreleased model might unleash a wave of cyberattacks.
Porsche's Wild Curved Display Is The Car Touchscreen Done Right

We check the Porsche Cayenne Electric's new folded touchscreen. Does it deliver a better experience?
China's EV Companies Aren't Just Making Great Cars. They're Making Money

While American and European rivals bleed cash transitioning to EVs, a new crop of Chinese EV startups are in the black.
BMW Pioneered Range Extended EVs. Now It’s Not So Sure

The Bavarian automaker is open to extended-range EVs, but it hasn’t decided whether it will jump on to the growing trend in the U.S.
OpenAI is narrowing its focus on things that make money
OpenAI shelved or modified plans for erotica, video, and Instant Checkout.
The Changan Deepal S05 has landed – an EV with tech that could really take off

This aircraft-inspired electric compact SUV sports a couple really clever tech additions that will make everyone in its path pay attention
I put a magnetic ring on my non-wireless charging phone — here's why you should too

Who says your phone needs to support wireless charging for you to use magnetic accessories with it? Magnets let you use more than magnetic wireless chargers.
"You can't build clever little games anymore," says RPG legend, unless you get lucky like Clair Obscur Expedition 33: "That doesn't please the stock market"

"For each of the big publishers, how many years has it been since they had a major new IP?"
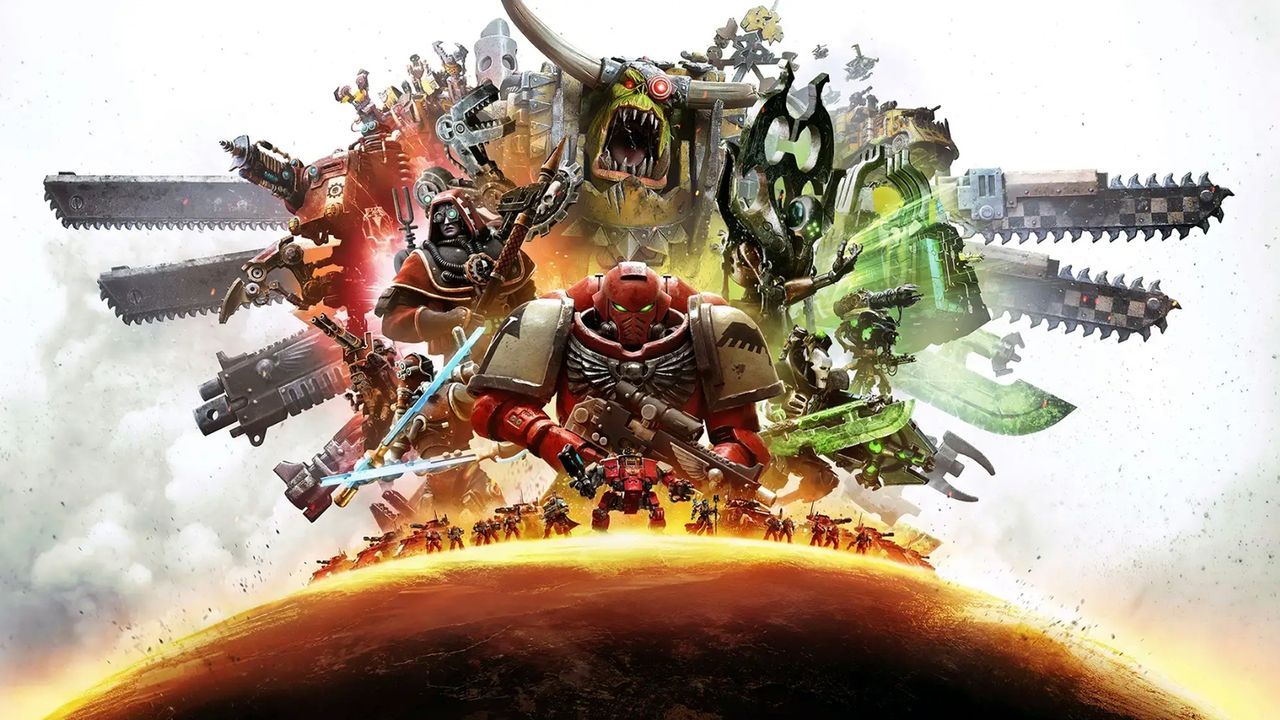
'Warhammer 40,000: Dawn of War 4': Release date, plot, factions, & everything else we know about the upcoming 40K strategy game
In the grim darkness of the future, there's only real-time strategy as the venerable Dawn of War series returns for a fourth entry.
The sea beneath Arctic and Antarctic ice holds many secrets. These scientists are trying to find them

The Arctic is warming four times faster than the rest of the planet
Hundreds of titles - just one subscription!
On sale for a limited time only, get 25% off for the first 3 months.
Kristen Stewart will play Sally Ride, the 1st American woman in space, as Amazon finally greenlights mini-series 'The Challenger'

In herTV series debut, 'The Twilight Saga' star will portray the first American woman in space.
NASA's Artemis 2 moon astronauts are 'fortunate' to have a private space toilet — Apollo crews pooped in plastic bags

The Apollo astronauts peed into roll-on cuffs and pooped into plastic bags in the presence of their crewmates, but the Artemis 2 spaceflyers will have access to a bona fide bathroom.
Making Canadian history: Artemis 2 astronaut Jeremy Hansen is ready for his epic moon mission
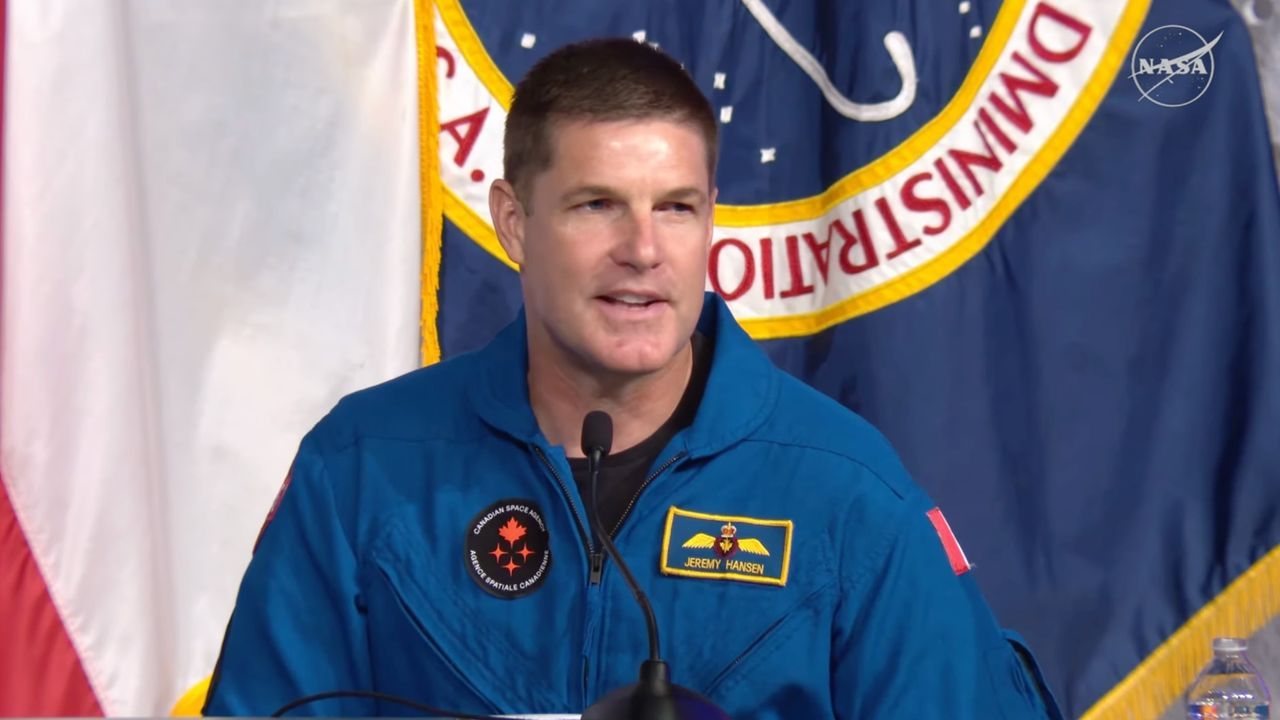
Jeremy Hansen grew up in a world with no Canadian astronauts. Soon, the Artemis 2 crewmate wil become the first person from his country to fly around the moon.
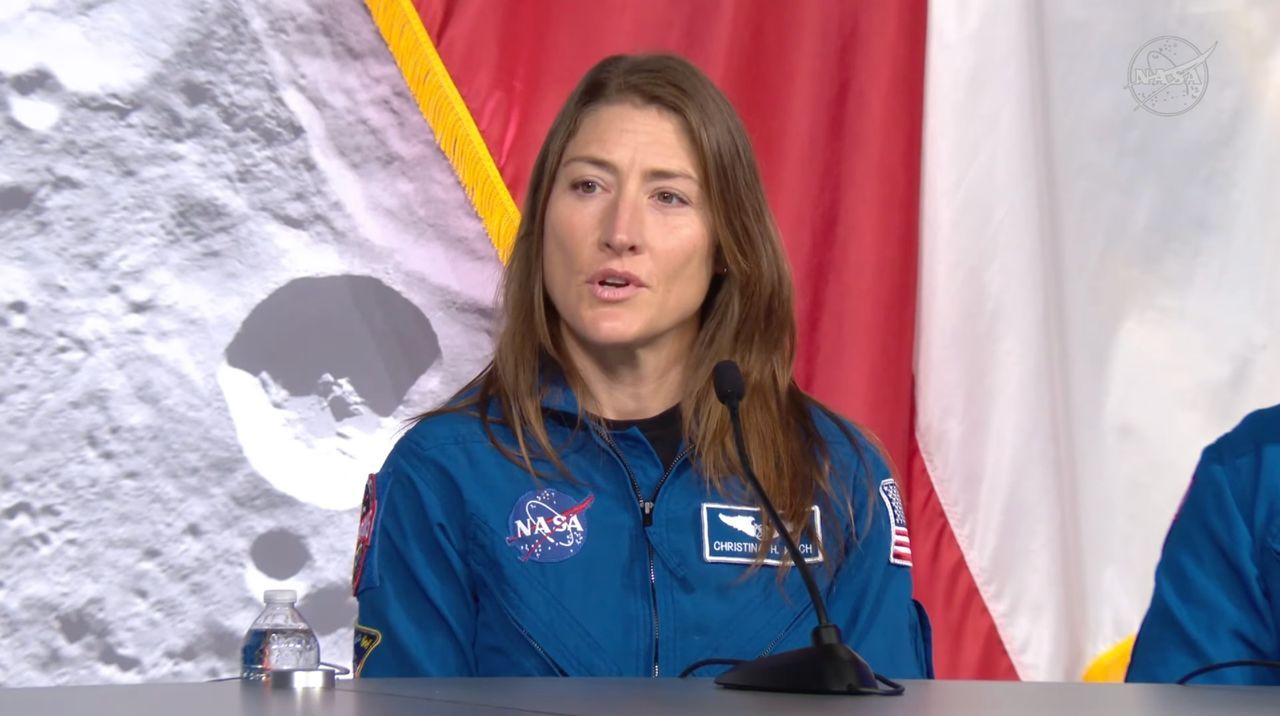
'An incredible privilege and responsibility': Artemis 2's Christina Koch is ready to become the 1st woman to fly around the moon
"We are firing on all cylinders."
'We work for them, too': Artemis 2 moon mission is for everyone, NASA astronaut Victor Glover says (video)
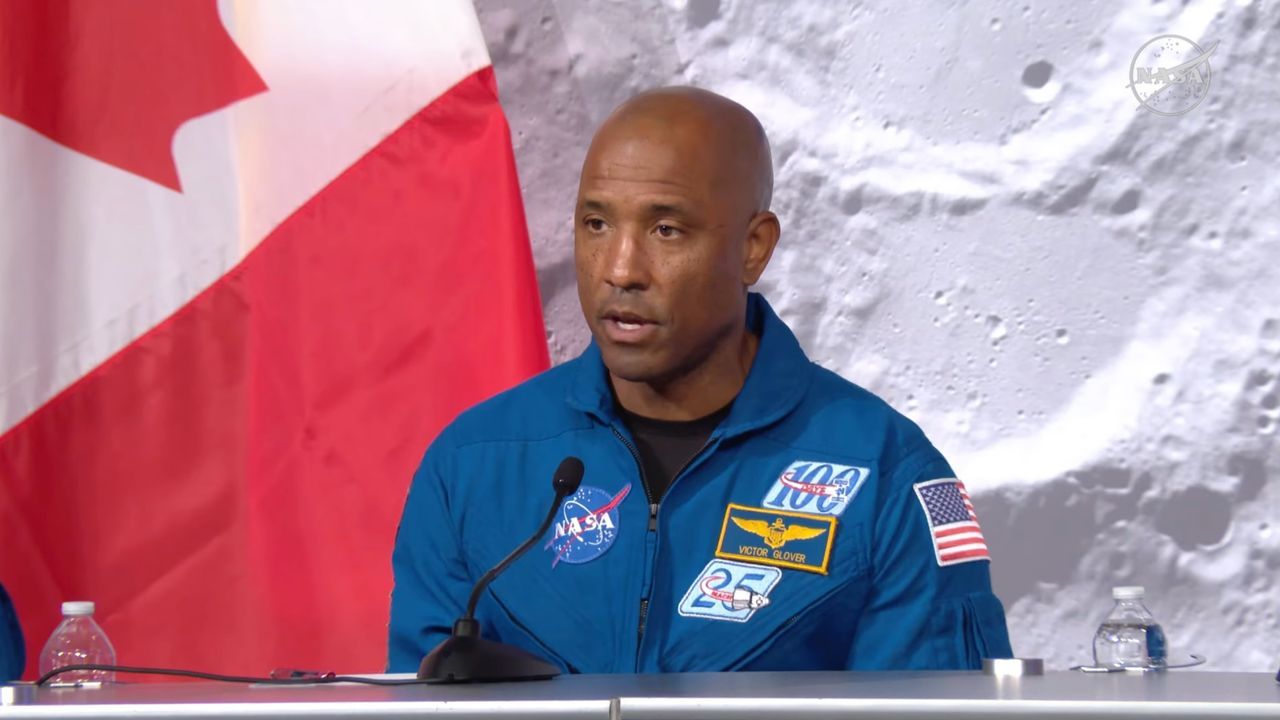
NASA astronaut Victor Glover says he is not solely focused on milestones for the Artemis 2 mission, but also on how to engage different communities about the crew’s work.
'We're all on this journey together:' Who are the Artemis 2 astronauts launching to the moon?

Four astronauts. Two countries. One destination: the moon.
'It's all I think about': Artemis 2 commander Reid Wiseman is zeroed in on historic moon mission

NASA astronaut Reid Wiseman, commander Artemis 2, the first moon mission in more than 50 years, says his crew will do his best to get the job done well.
Where should we send a real 'Hail Mary' spacecraft? A new study has the answers

A new atlas of 45 potentially habitable planets makes us think of the new film "Project Hail Mary," based on the book by Andy Weir.

Rachel Reeves to tell G7 accelerating shift to clean energy is best defence against energy price shocks
Starmer to convene major energy industry and insurance figures to draw up emergency plans amid continued blockade of strait of Hormuz
Toxic Pfas residue identified on 37% of California produce, new analysis finds

Peaches, strawberries and grapes were almost always found to be contaminated with ‘forever chemicals’ in the analysis
Hundreds of titles - just one subscription!
On sale for a limited time only, get 25% off for the first 3 months.
Nigel Farage’s farming adviser calls for wheat prices to double

Exclusive: critics warn Reform UK use of trade policy would increase food costs amid cost-of-living crisis
How EVs could be part of answer to UK’s fuel reserve worries
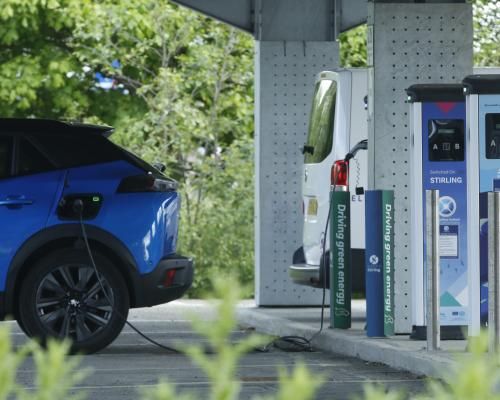
More use of two-way charging will earn money for owners and could avoid the need to expand North Sea oil drilling
‘The start of the healing process’: the vital work to restore Britain’s peatlands

A project on Dartmoor to reprofile the landscape aims to return the springy bog – and carbon store – to its natural condition
Cambridge offers botany course that inspired Darwin after rare archive uncovered
University’s botanic garden will use study materials created by John Stevens Henslow, the naturalist’s mentor, 200 years ago
Climate Activists Confront Iran War Profiteering at Big Oil Confab in Houston

Meanwhile, the U.S. energy secretary tries to soothe an anxious American oil industry, urging them to ramp up production amid shock to global markets.
Earth hour turns 20 at pivotal moment in climate action
From the Sydney Opera House to the world, the 20th anniversary of Earth Hour comes at a critical time in the global response to climate change.
As high seas treaty takes shape, Galapagos proves that protection pays off

A global treaty designed to protect the high seas is entering a decisive phase, as countries meet in New York this week to work out how to turn it into action. At the same time, a real-world example in the Galapagos shows what effective ocean protection can look like –…
‘It helped me feed my six children’: how Africa’s first water fund supports farmers to protect Kenya’s biggest river
Conserving the watershed of the Tana and improving farming methods is securing water supplies and livelihoods alike in a changing climate

My search for the perfect Sachertorte in Vienna
The luscious chocolate and apricot torte is the stuff of legend in the grand, old world of Viennese coffeehouses. But which makes the tastiest?
Tokyo and Nagoya: a tale of two cities

Tokyo or Nagoya? Do both, says Harriet Cooper
Hundreds of titles - just one subscription!
On sale for a limited time only, get 25% off for the first 3 months.
Some major US airlines may ‘not survive’ unless oil prices come down soon, experts warn
Jet fuel prices have ‘more than doubled in the last three weeks,’ United Airlines’ CEO warned
Barcelona: how to spend 48 hours in Catalonia's thriving capital

From gorgeous buildings to streetside cafes offering vermouth and cava, there’s always plenty to do
20 fabulous family spring days out in the UK

Join the Famous Five in Dorset, relive Springwatch in the Peak District … our selection of Easter treats will keep all the family entertained
‘A kaleidoscope of colour and life’: readers’ favourite UK spring days out

Your top tips for seasonal outings from birdwatching to gorgeous gardens, amazing architecture and more• Tell us about a trip to Spain – the best tip wins a £200 holiday voucher
Tala Alamuddin's insider guide to Lamu

The accessories entrepreneur, and sister-in-law of George Clooney, sails a dhow through mangroves and soaks up the Swahili culture on Kenya’s paradise island
The perfect solo travel guide to Kuala Lumpur

Malaysia’s concrete jungle capital sees low-key food joints jostle with world-class hotels. Here’s how to make the most of it when travelling alone
United Airlines Launches 'Relax Row'—Economy Seats That Turn Into Couches For Long Flights

Discover United Airlines' new 'Relax Row' concept, transforming economy seats into couch-like spaces for added comfort on long-haul flights
Tell us: have you used AI to plan a holiday?
We would like to hear from holidaymakers about their experiences of using AI
