In housing debates, it is common to hear that more dual-income families mean more money driving up rents and prices, or that high housing rents and prices are why families now need two incomes.
I get the intuition behind such claims, but they reflect the past through rose-coloured glasses. What does the best data show about the rise of dual-income families, and how should we think about the economics at play?
A century-long view
In 2020, overall female labour force participation was 61% across all age groups. In 1920, it was about 25%. But as the chart below shows, the big shift took place from 1960 to 1990 — by 1991 participation had already doubled to above 50%.
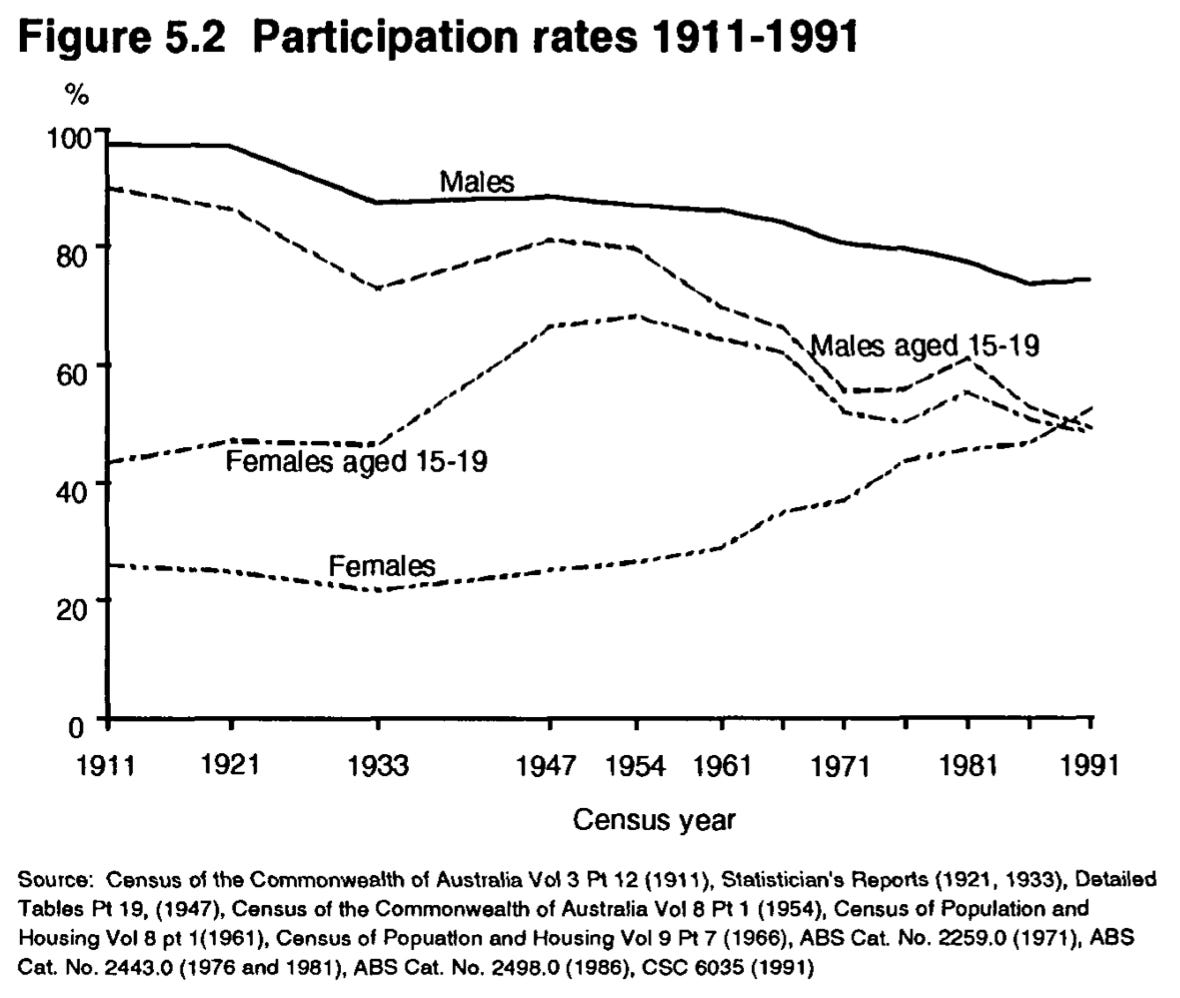
Young women shifted into the workforce during World War II, with a large boost in 15- to 19-year-old women (and men) working between 1933 and 1947. The big picture of the second half of the 20th century is that the youth began working less (both male and female), and in general more women began working while fewer men did.
We need to remember that the 75% of women not in the formal labour force during the first half of the 20th century were mostly still working. The informal household economy was much bigger than today, especially in terms of the time needed for cooking, cleaning, etc.
In terms of housing, prior to World War II, homeownership was only about 43% in Australia’s urban areas. So there were a lot of single-income households, but not many buying homes.
1960s and ’70s
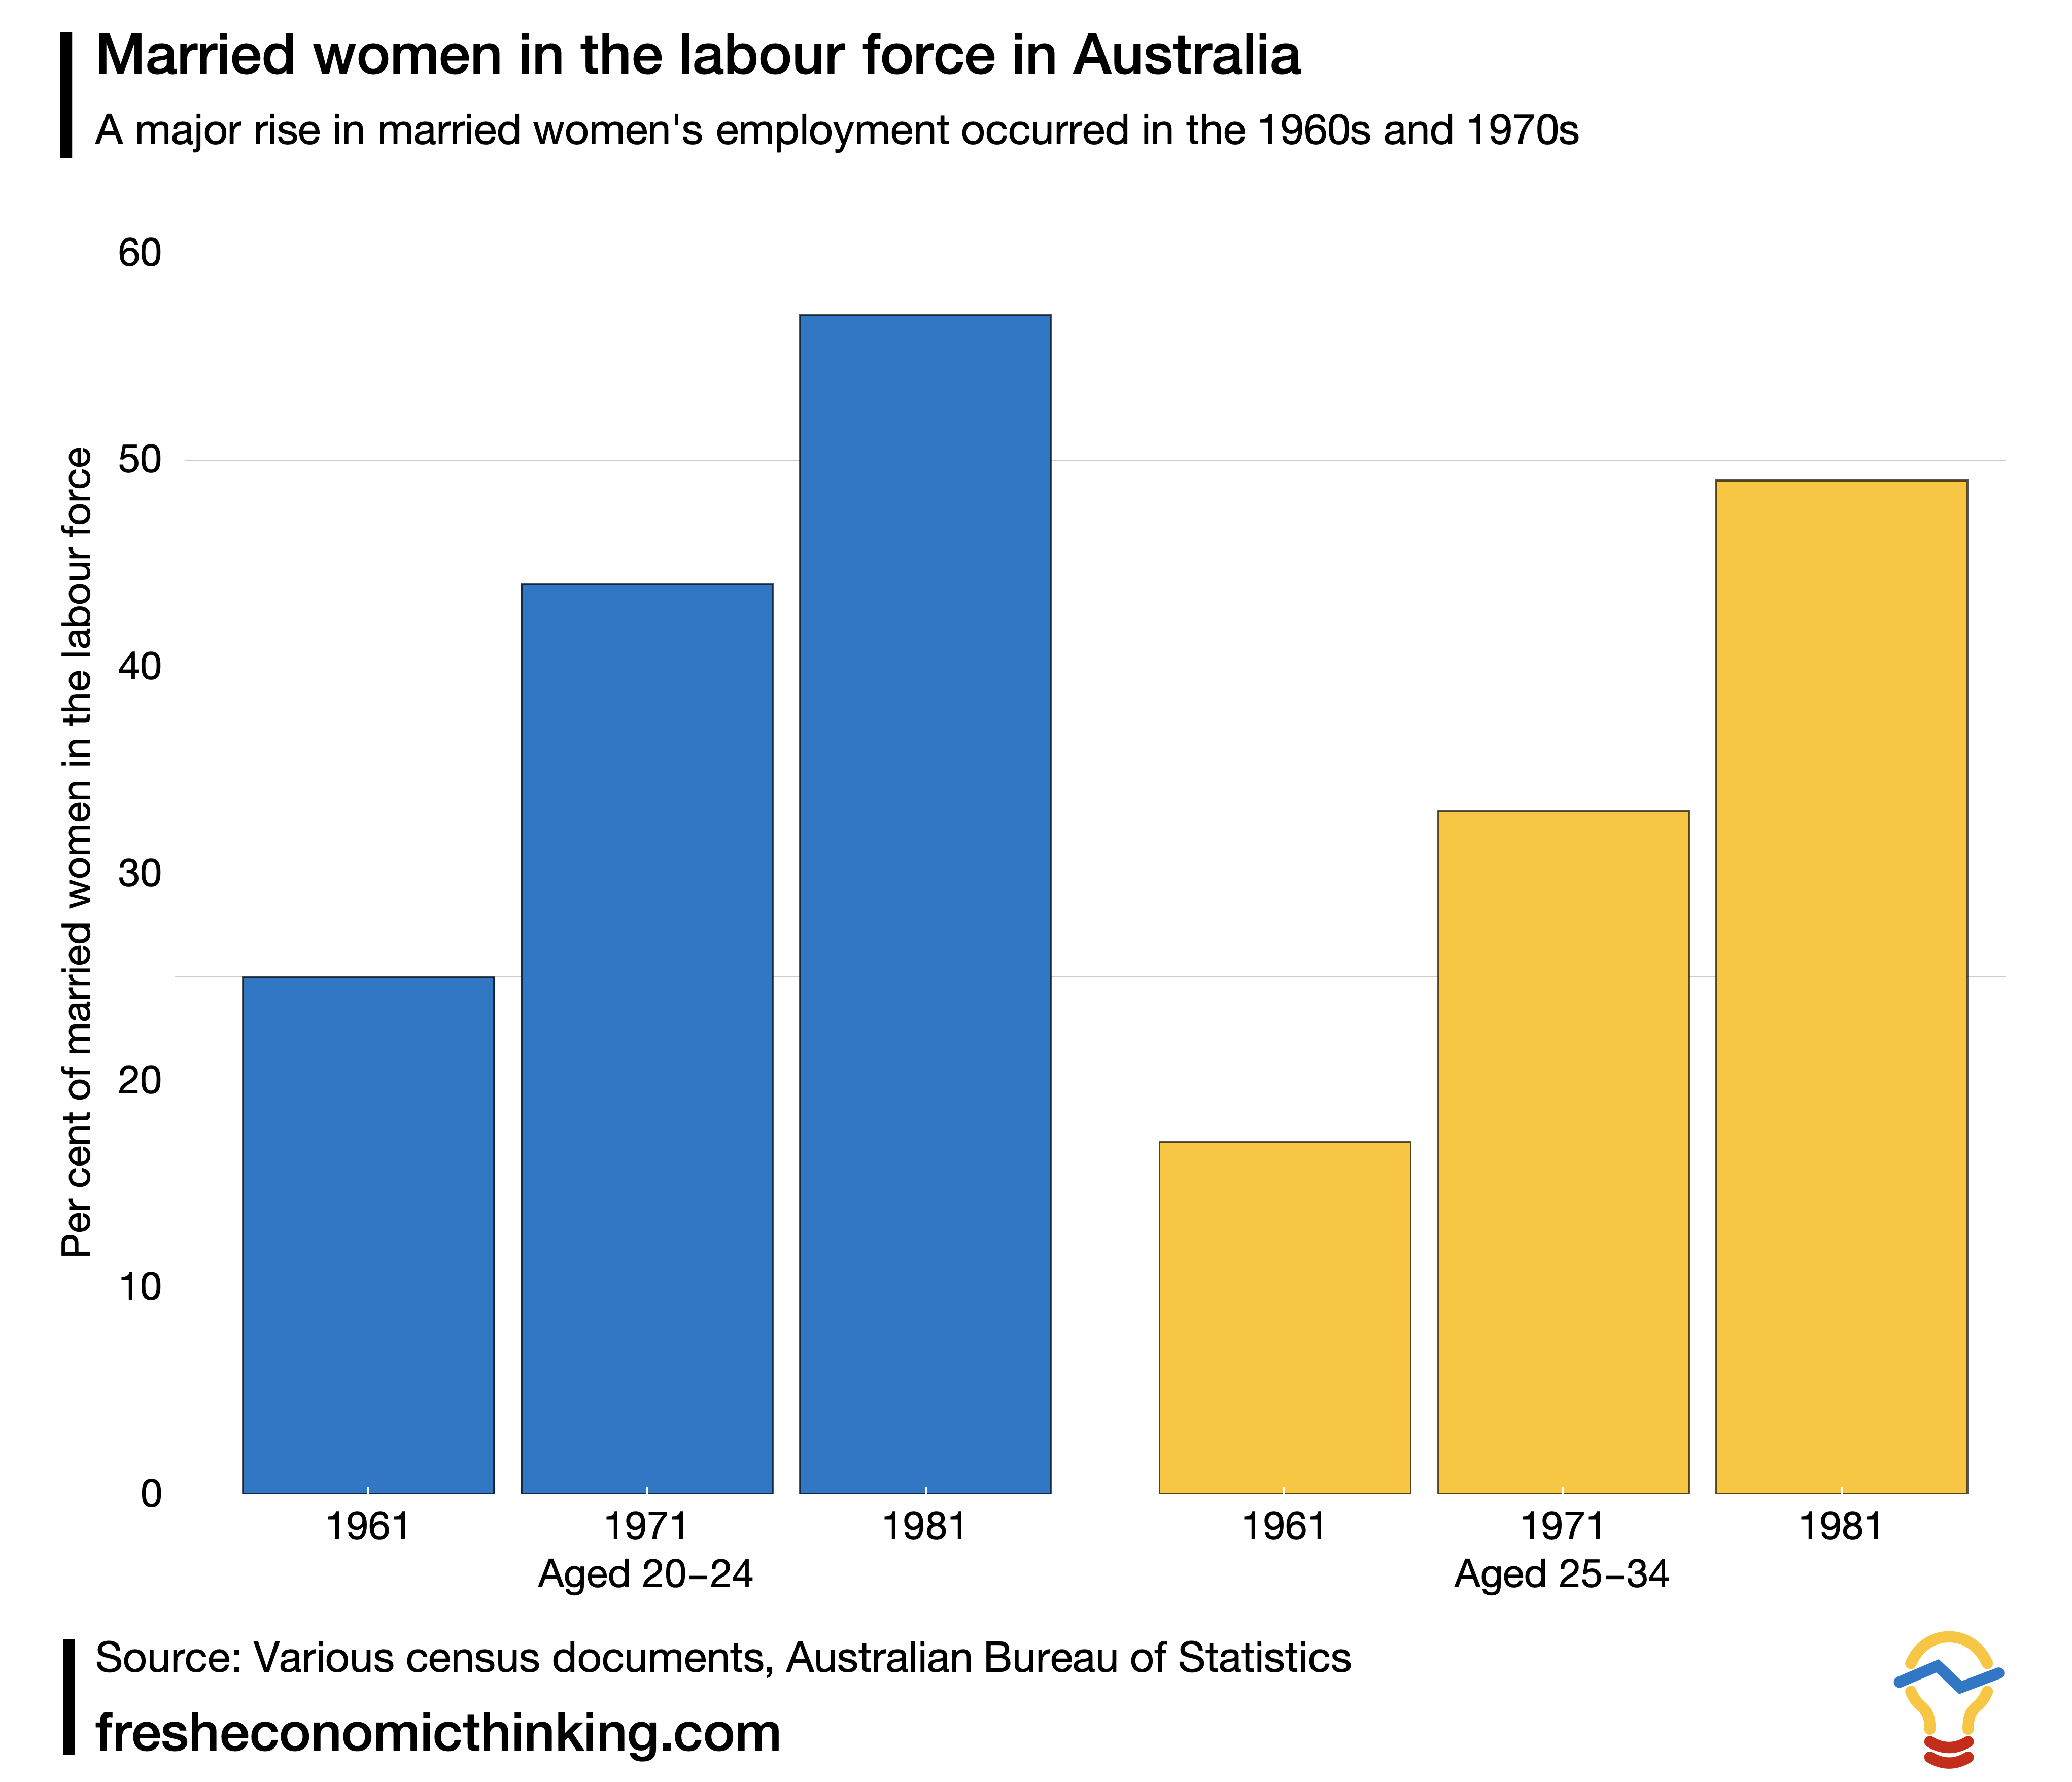
The 1961 census recorded that of married women in Australia, 25% of them aged 20-24 were working, while 17% of them aged 25-34 were employed (page 224 of this census report). This suggests something of a decline in working after married women had children, which makes sense, as child-rearing is a time-consuming activity (a job in its own right) and in the 1950s and 1960s there were plenty of children about.
We can look to the 1971 census to see how these figures changed. By then, more than 44% of married women aged 20-24 were working. For married women aged 25-34, 33% were working. By 1981 the proportion of married women aged 20-24 in the workforce had increased to 57%. For those aged 25-34, it was 49%.
In terms of housing, it is interesting to note that the homeownership rate in Australia peaked in 1971. During the 1960s married women worked more and homeownership increased. In the 1970s even more married women worked and homeownership decreased.
The dramatic scale of the changes to married women’s workforce participation in the two decades of the 1960s and 1970s is clearly seen in the below chart.
The 1981 census also broke out parental labour force participation. This helps us understand more about dual-income families with children (as there are many married couple households without children, either before kids or after the kids have left home).
In that year, 44% of married couple families with at least one child aged under 16 had two parents working. If we include unemployed mothers (who were not working but looking for work), the number is closer to 47% and is not much different from the 49% figure on the proportion of married women in the labour force aged 25-34 from that same year. This means that most married women aged 25-34 had at least one child at home, and nearly half of them worked.
The 1980s onwards
From 1979 forward, we can also look at households with children specifically using details contained in the monthly labour force survey (rather than the census) to get a better feel for the changes over time.
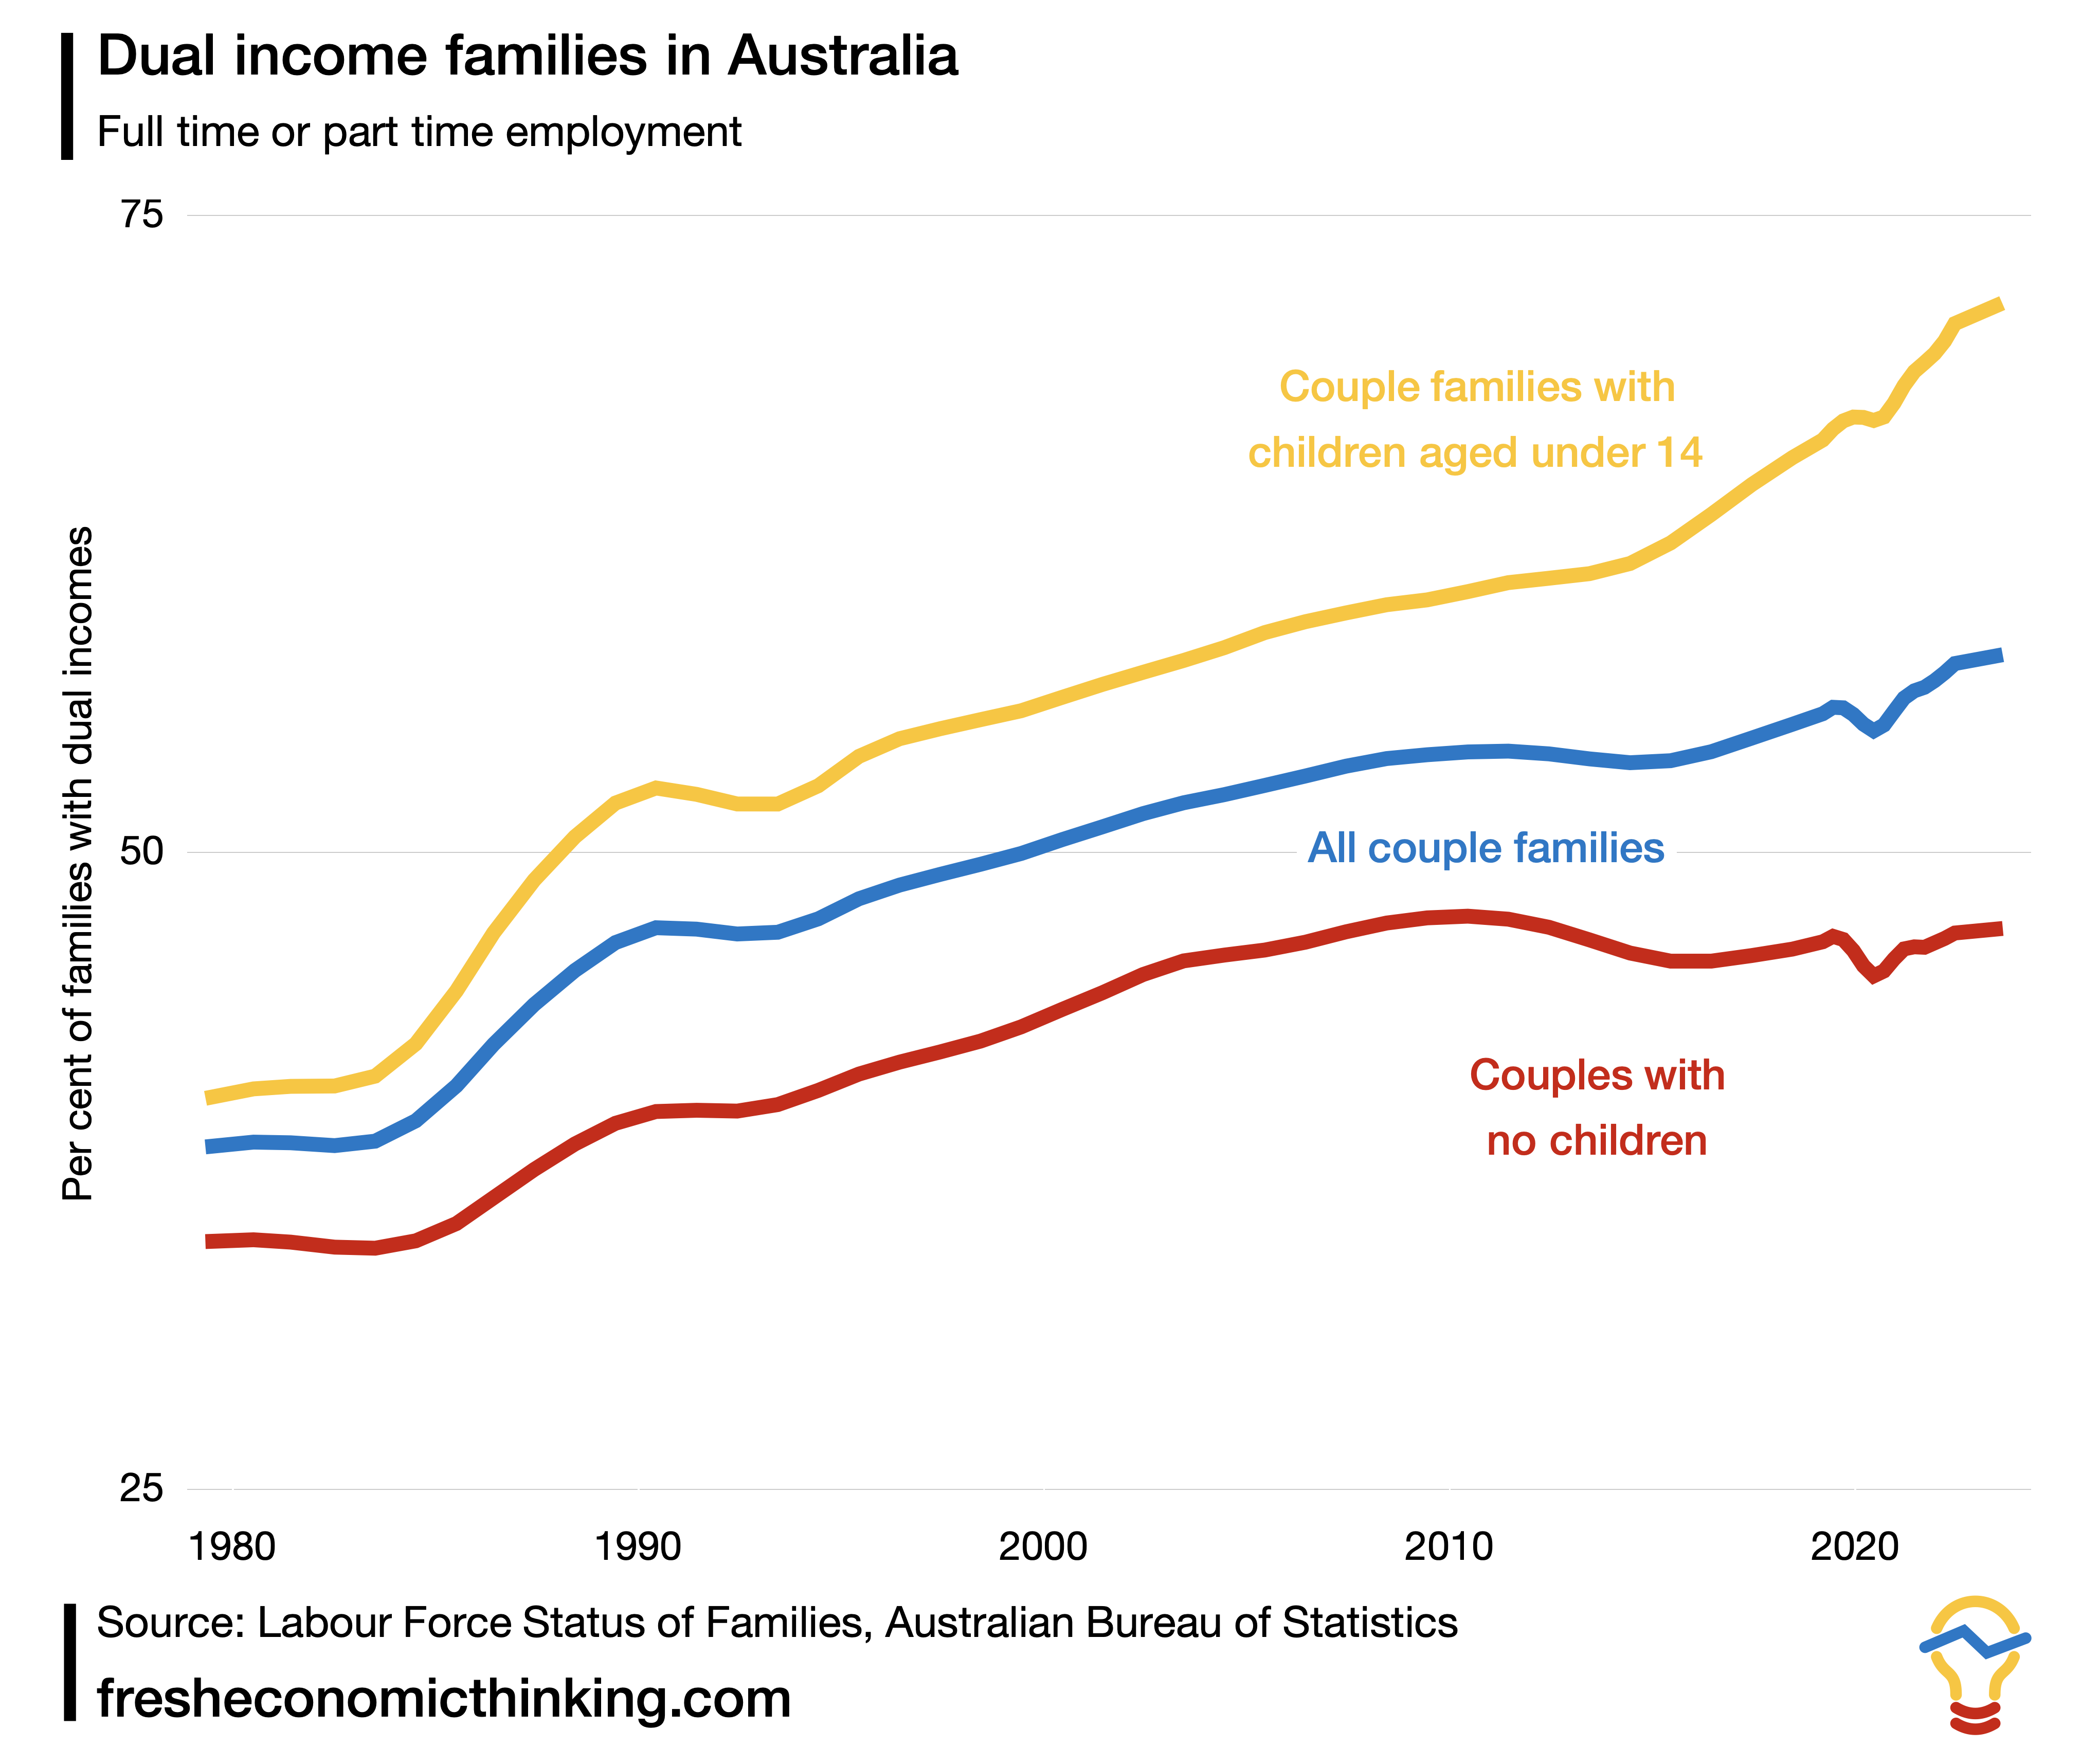
Below I’ve plotted the proportion of dual-income couple households (with and without children) for the past 45 years from this data source. Unfortunately it does not differentiate between full-time and part-time work.
Nevertheless, it shows a continuation of the trend of rising dual incomes. During the 1980s, dual-income families with children grew from 41% to 55%. It took from 1990 to 2022 to rise another 14% points to 71%. Most of that change happened since 2014, with the dual-income rate for couples with children rising from 61% to 71% in the past decade.
I don’t know why there has been a steep rise in this trend since 2014. Perhaps a few factors are at play, such as having children later in life, child-care policies, or generally favourable economic conditions (i.e. both parents work when the payoff to working makes it worthwhile to give up the time for other household activities).
Notable, homeownership rates, after steadily declining since the 1970s, started to increase for many younger cohorts from 2016 to 2021 (when comparing census years). I wonder if these extra dual incomes had an effect.
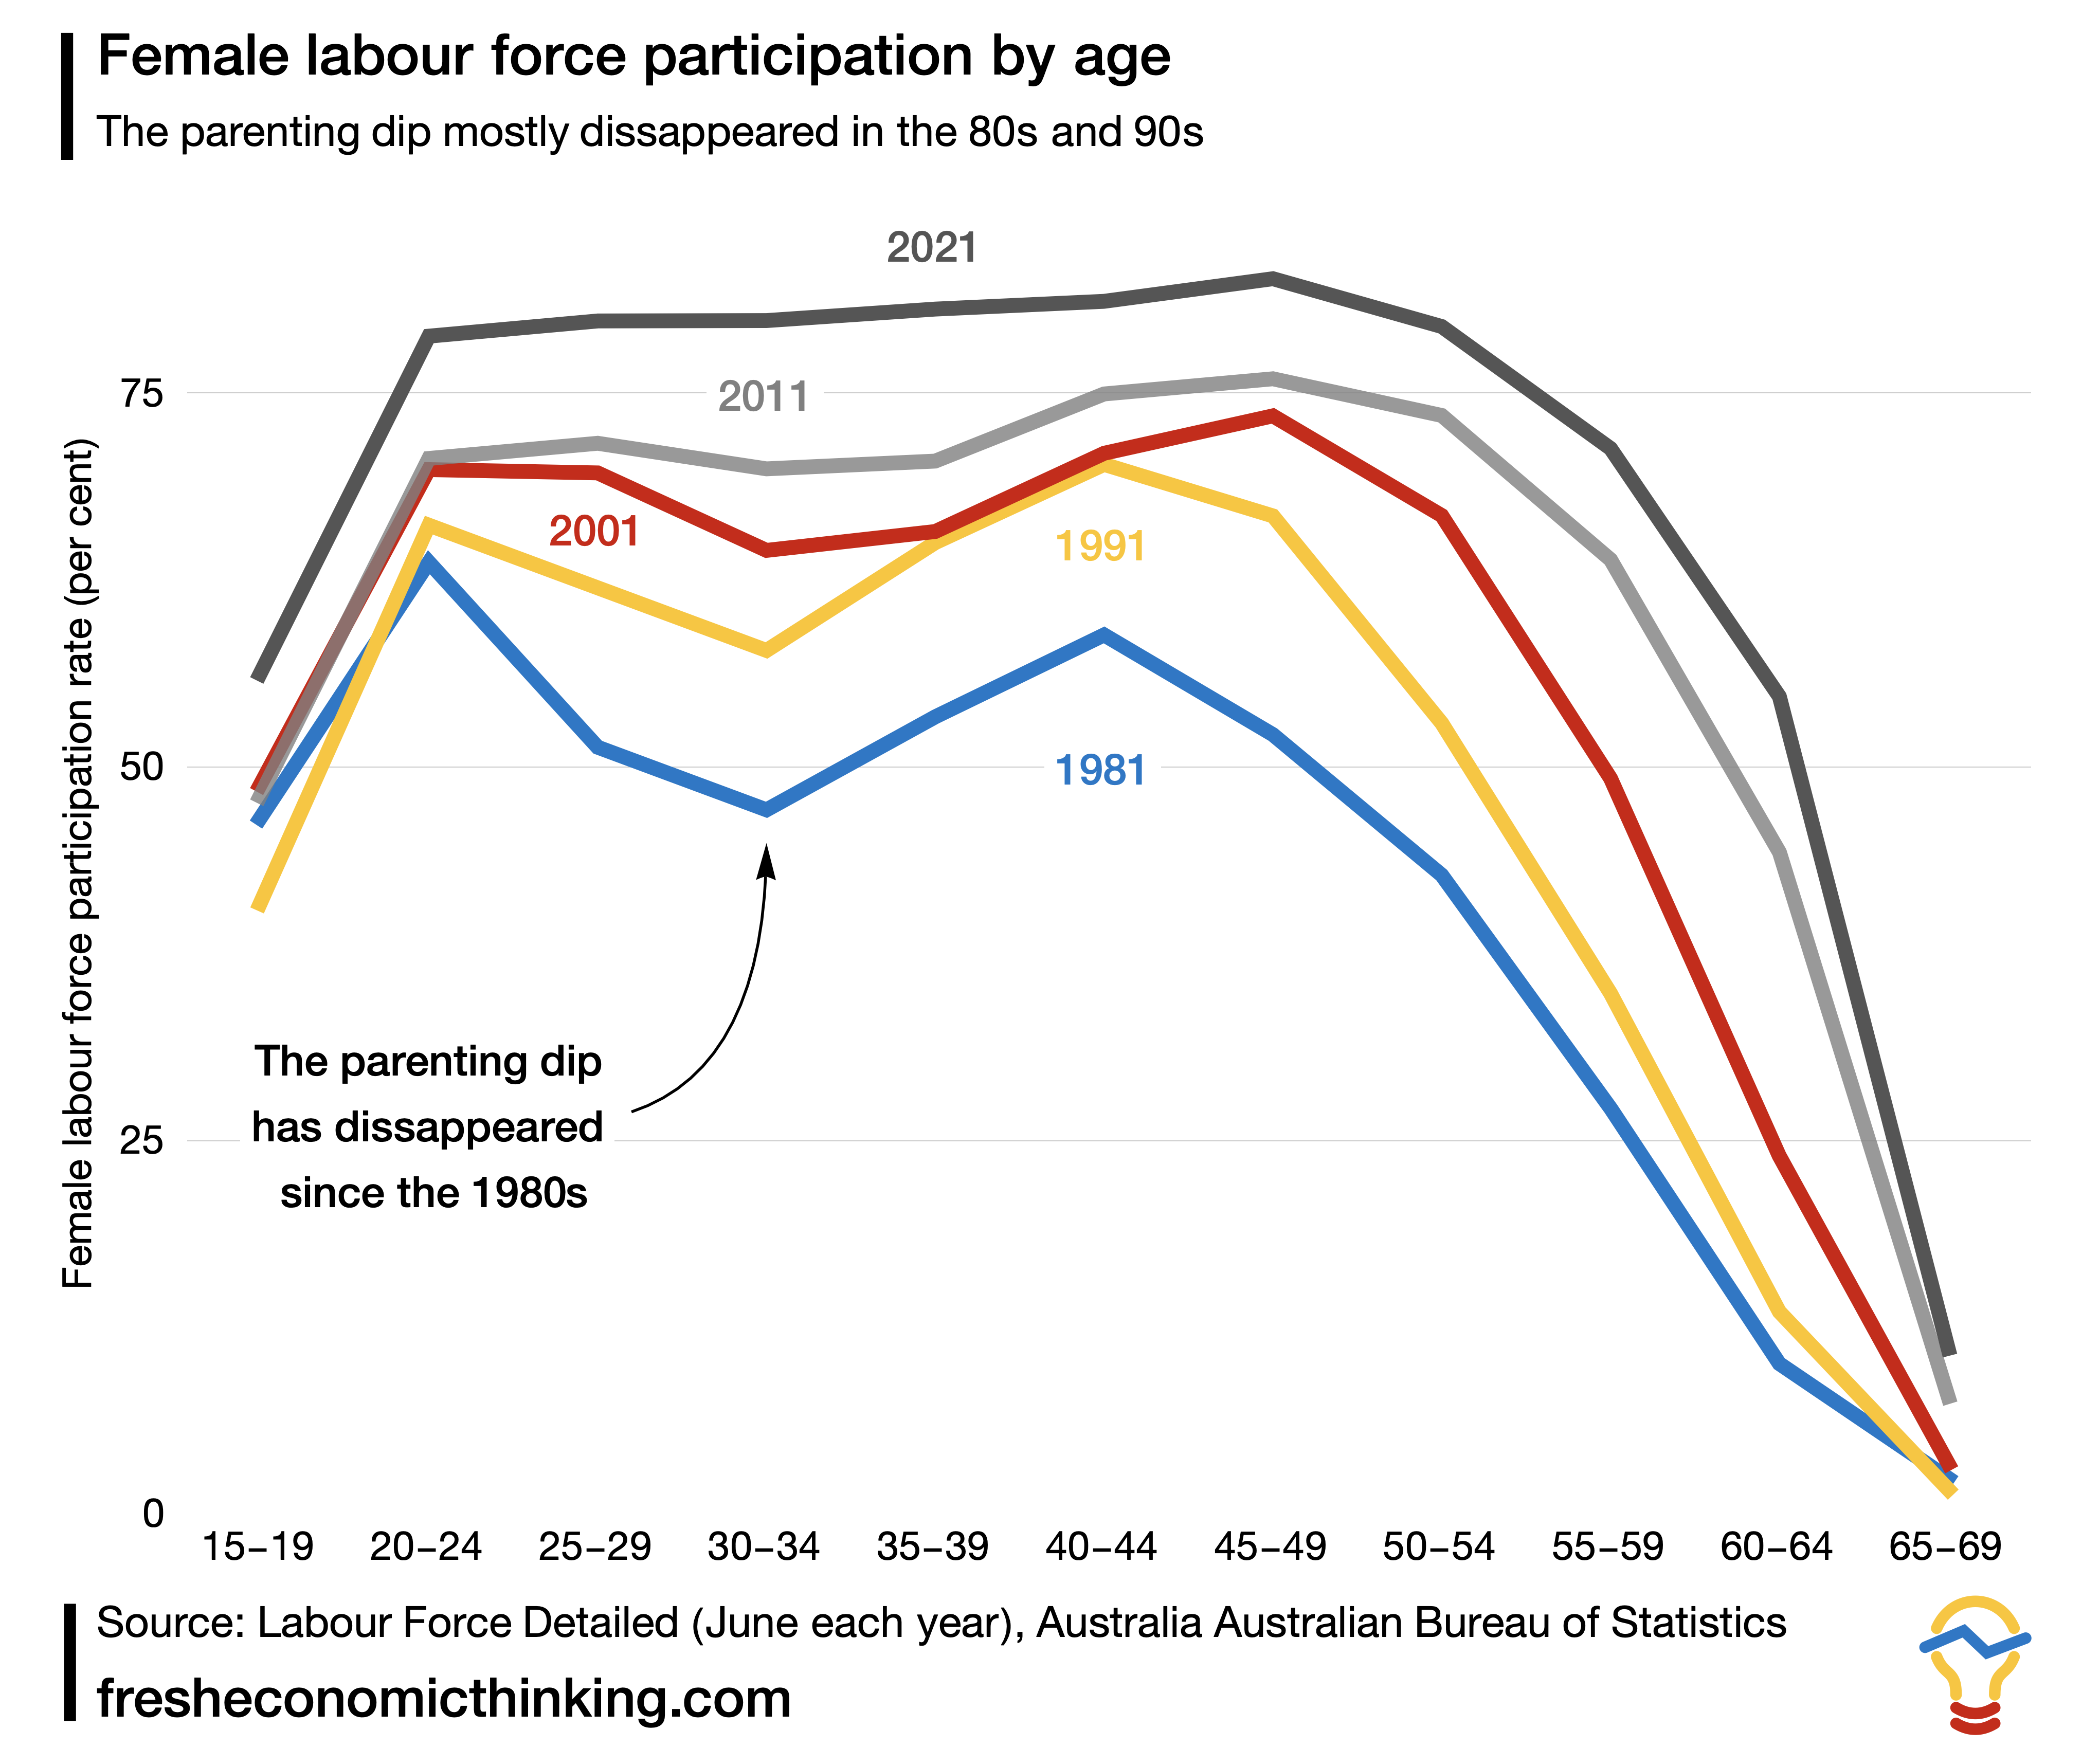
The patter above really is mothers working more, as the chart below shows. Although family work patterns were changing dramatically in the 1960s and ’70s, since then the big change is that the parenting dip, whereby mothers choose informal household work over formal work during child-rearing years, has gone. Most of the change happened in two waves, during the 1980s and in the past decade, consistent with the two periods of rapid change seen above.
But there is more to the story, as formal work is more flexible than ever and these charts lump in all work as equal, whether full-time, part-time or casual.
Part-time vs full-time in the past decade
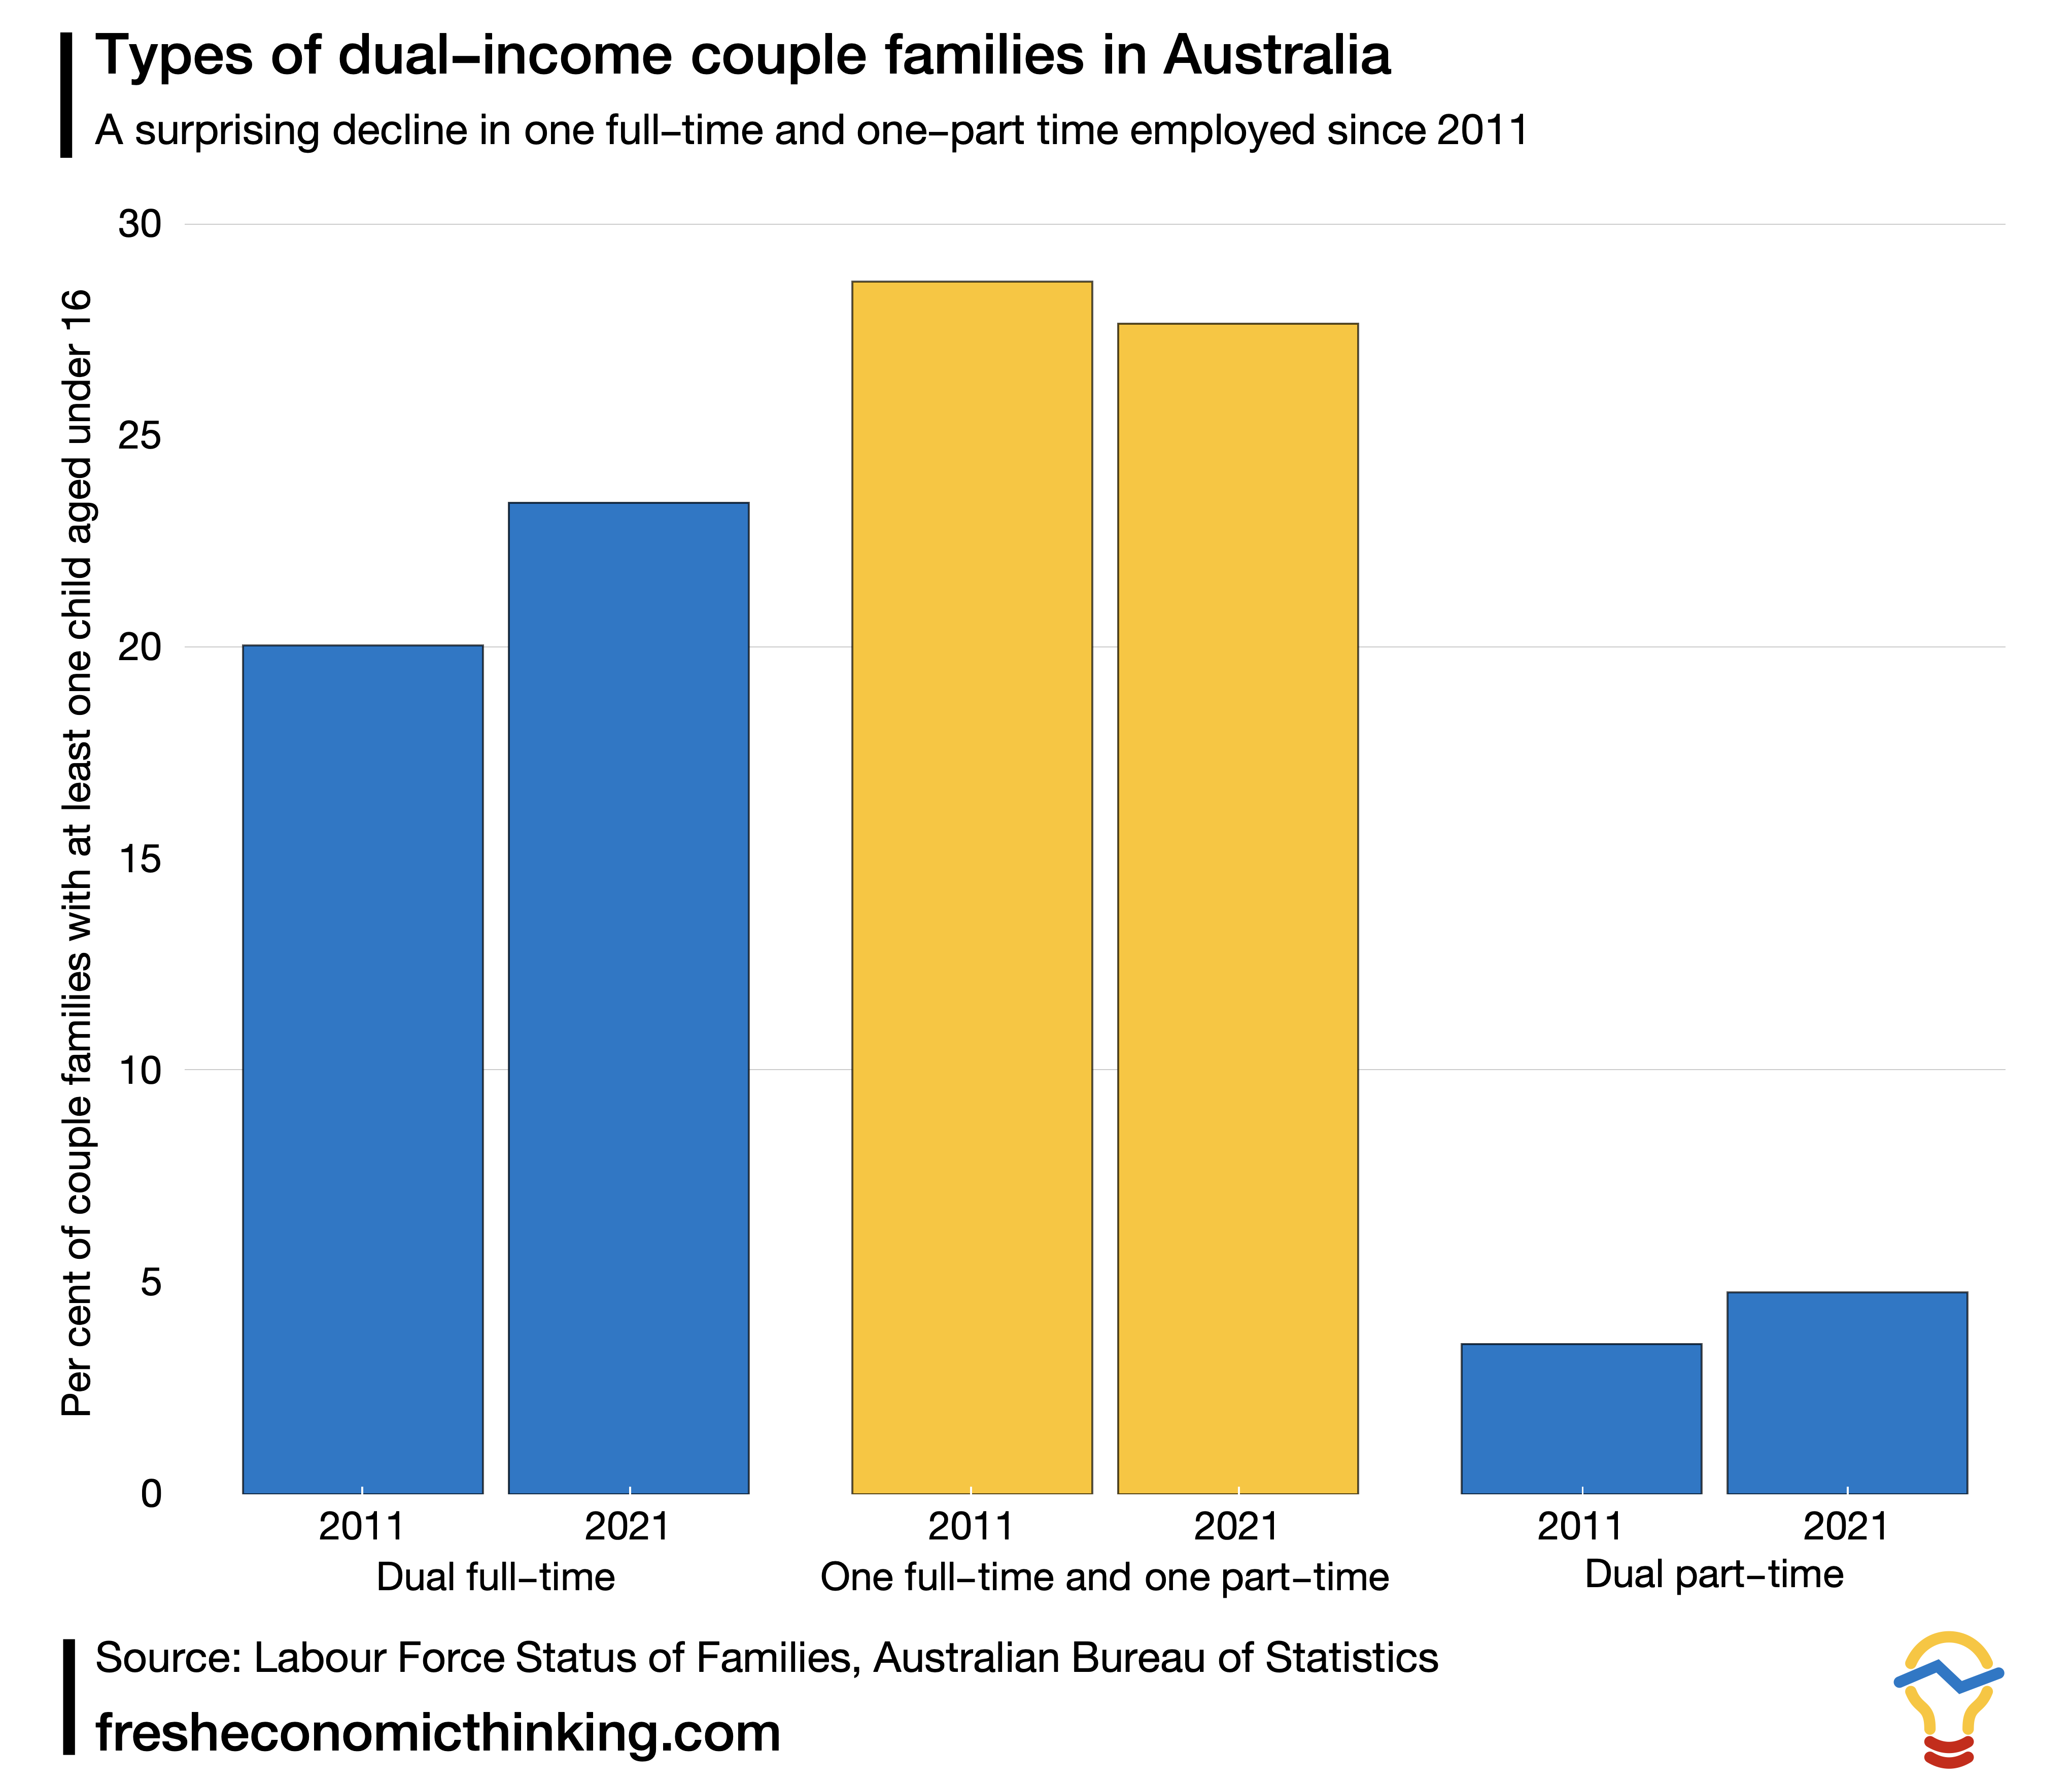
Since 2011 we can also look at part-time and full-time employment.
There are interesting patterns here that I didn’t expect. There has been a small but surprising decline in dual-income families with children where one parent works part-time and one parent full-time. Perhaps this has to do with the COVID effect of the 2021 census. We will only know in a few more years.
In contrast, however, there was a 3.4% rise in dual-full-time families and a proportionally quite large rise in dual-part-time families.
So how do these numbers fit with the stories about how these days “it requires two incomes” to buy a home?
Honestly, when you look at the data, you don’t see much of a story with homeownership at all. What appears to be happening is that more households choose to be dual-income families during periods of economic growth, as the financial and time trade-off between a stay-at-home mother and working shifts towards working. These higher-income households then also bid against each other to rent or buy homes in better locations.
It is certainly true that if, by coincidence, many dual-income households decided to become single-income households, rents and home prices would fall. But I just don’t see how this happens voluntarily. It seems more likely we will “go Dutch”, where dual-part-time work households become more common during that “parenting dip”.
This is an edited republication from Cameron Murray’s Fresh Economic Thinking newsletter.