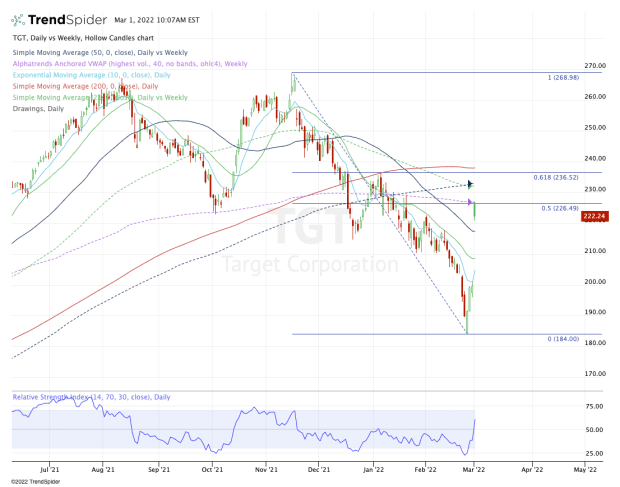
Target (TGT) shares are bucking the volatility on Tuesday, ripping higher by 11% after the retailer reported earnings.
The better-than-expected earnings are — at least for one day — helping snap quite a nasty trend in the share price.
Now riding a four-day winning streak, Target stock is up 21.5% from last week’s low. Before the multi-day rally though, shares were down 31.5% from the high made in mid-November.
Last quarter, Target beat earnings expectations and missed on revenue estimates despite 9.4% year-on-year sales growth. However, comp-store sales were solid and guidance came in ahead of expectations.
The news comes a day after TheStreet noted Target’s pay increases will put pressure on Amazon (AMZN) and Walmart (WMT), two stocks that both rallied on earnings earlier this year.
Target is trying to snap a four-month losing streak, in which the stock fell in 12 out of 15 weeks. Two out of those three up-weeks came on gains of less than 1%.
Can it snap the downtrend now?
Trading Target Stock

Chart courtesy of TrendSpider.com
Target stock is giving us some really interesting price action when we overlap some weekly measures onto the daily chart.
Shares gapped above the 50-day moving average and opened at a key level: the 50% retracement of the current range and the weekly VWAP measure.
That latter was support throughout the fourth quarter, but eventually turned to resistance in January after the stock broke through this measure and couldn’t reclaim it.
Now we have a very clear roadmap for Target stock.
On the upside, we are looking for a move above today’s high of $227.10, as well as the weekly VWAP measure and the 50% retracement. That opens the door to the $232.50 area, which is where traders find the 21-week and the 50-week moving averages.
Above that is the $236.50 to $238 zone, where we find the 61.8% retracement and the 200-day moving average. It’s step by step, level to level.
On the downside, keep an eye on today’s low. Currently that’s at $220.72, but that could change by the end of the day.
A break of today’s low puts the 50-day in play, a measure that bulls really want to see the stock stay above. Back below puts the $210 area on the table, near the 21-day moving average and as the 10-day turns higher.
Below that and we may see a full gap-fill at $201.18. The hope is that bulls don’t let a great earnings reaction go to waste, but this wouldn’t be the first sell-the-news reaction we’ve seen on earnings this year.


