What a whirlwind of a few days in the stock market.
On Thursday, a hotter-than-expected CPI report initially sent the S&P 500 down to its lowest level of the year. Stocks then put together a massive reversal that saw the S&P rally almost 200 points off the session low.
Now the market is pulling back on Friday, but it’s doing so alongside a general rally in bank stocks, as the group kicks off third-quarter earnings.
In that light, I want to take a closer look at the banks.
Trading JPMorgan Stock
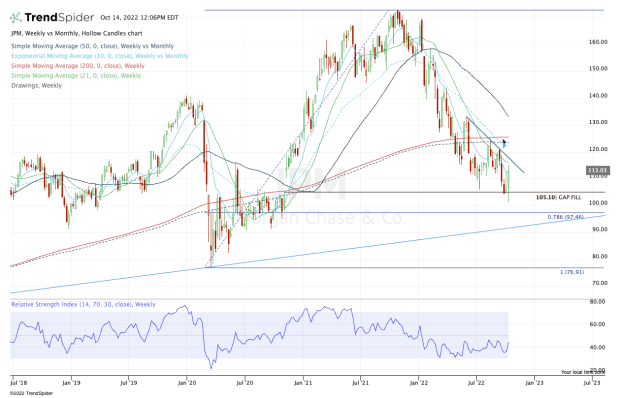
Chart courtesy of TrendSpider.com
Shares of JPMorgan (JPM) are up about 2.5% after the big dog of the bank stocks delivered a top- and bottom-line beat. (Spoiler alert: All the banks on this list beat on earnings and revenue expectations.)
On the weekly chart above, JPM looks to be stuck between a rock and hard place. Downtrend resistance has been too tough of a hurdle since summer, while the 10-week and 21-week moving averages continue to squeeze the stock lower.
On the downside, the stock finally filled the gap near $105, although larger support looms down at the 78.6% retracement and uptrend support (blue line).
For what it’s worth, that uptrend mark stretches all the way back to 2009. This would be a reasonable area for bulls to buy.
Over $125 and this stock could have some strong momentum.
Trading Wells Fargo Stock
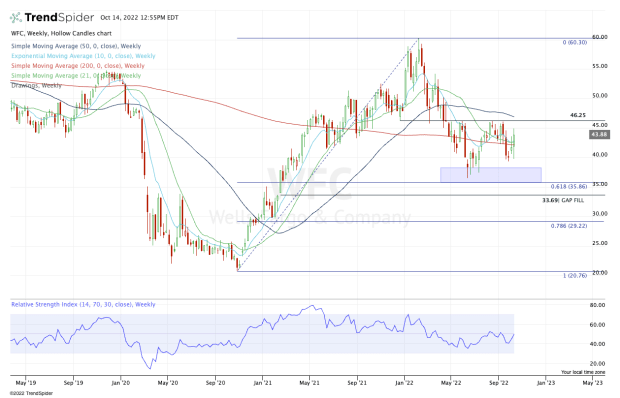
Chart courtesy of TrendSpider.com
I am surprised to see the bank stocks trading well on the day and the market down rather notably. It seems as if either the banks would have been able to lift overall sentiment or the market selloff would weigh more on the banks.
In any regard, Wells Fargo (WFC) delivered solid results.
On the upside, keep an eye on the $46 to $47 level. That has been a key pivot so far in 2022 and it’s also where the 50-day moving average comes into play. Over these measures puts $50-plus in play.
On the downside, keep an eye on $40. A break of this area could usher in a retest of the lows near $35, as well as the 61.8% retracement. If Wells Fargo stock dips this low, the bulls will want to see the stock find support.
Below that and the $33.69 gap-fill sticks out.
Citigroup
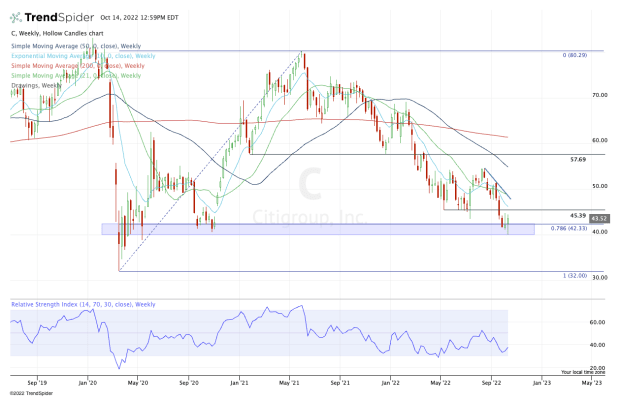
Chart courtesy of TrendSpider.com
Thankfully, the chart for Citigroup (C) is fairly straightforward after what some are considering a mixed quarter.
The shares are higher by about 1.5% at last check, but they remain below last week’s high and the key $45 to $45.50 zone.
If it cannot clear this level, the $40 to $42 zone remains in play. Not only does this zone contain the 78.6% retracement but it’s been strong support following the 2020 selloff.
If it breaks, Citigroup stock goes down to no man’s land and technically speaking, the 2020 low at $32 could be in play at some point.
But if Citigroup stock can clear the $45.50 level, it opens the door to the 21-week moving average and downtrend resistance.
Above that could put $54 to $55 in play, along with the 50-week moving average.