The telecom trade has not gone that great. Verizon (VZ), AT&T (T) and T-Mobile (TMUS) continue to struggle.
All three stocks are lower on the year, AT&T by about 14%, Verizon roughly 9% and T-Mobile 1.5%.
The situation doesn’t improve much when we look at the one-year returns, either. Verizon and AT&T are down 30% and 25%, respectively. T-Mobile is actually up about 3%.
Don't Miss: Buffett's Berkshire Hathaway: Another Opportunity to Buy the Dip
Because of the large dividends from AT&T and Verizon, though, some investors may focus on total return, which does improve the results (although does not get the stocks out of negative territory for either time frame).
The charts previously helped investors nail a low in AT&T. Can they do so again?
Trading AT&T Stock

Chart courtesy of TradingView.com
It makes a big difference if we’re looking at unadjusted vs. dividend-adjusted charts. The one above is adjusted for the dividend.
The bulls would like to see this month’s low near $15 hold as support. That’s roughly where the 200-month moving average also comes into play, a measure that has been support for about 20 years now.
Don't Miss: Buying the Dip in WingStop Stock After It Touches a Record
Notice, though, that overshoots of this level are not uncommon. If $15 doesn’t hold, the 2023 low could be back in play at $14.06. That’s the top end of a very key area, between $13 and $14.
From the late-1990s until 2012, this zone was resistance. Since 2012, it’s been support.
For those using the unadjusted chart, see that the $14 to $15 area holds as support (which contains the 52-week low at $14.46 on an unadjusted basis).
On the upside, if the bulls regain control, then the $17 to $17.50 area could be in play. Above $18 could put the gap-fill in play near $19.60.
Trading Verizon Stock

Chart courtesy of TradingView.com
Here’s another look at a dividend-adjusted chart with Verizon. As with AT&T, the 200-month moving average has been strong support for this name.
The bulls might consider buying Verizon on a retest of this measure and the October low near $33.50.
Don't Miss: How High Can AMD Stock Go? Chart Provides a Clue.
For those using an unadjusted chart, keep a close eye on $34.50, which is the 52-week low and a recent bounce spot. A break below this measure could open the door down to the $30 to $32 area.
Trading T-Mobile Stock

Chart courtesy of TrendSpider.com
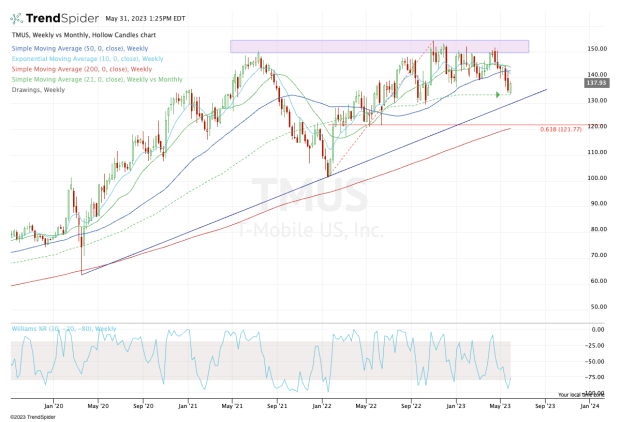
The $150 area continues to contain the rallies and act as resistance. After declining in six of the past seven trading weeks, T-Mobile stock has broken below the 10-week, 21-week and 50-week moving averages.
Now that it's rallying off the 21-month moving average, the bulls are looking for some momentum. If the shares can push above $145, they'll regain the aforementioned moving averages, although $150 to $155 remains stiff resistance for the time being.
On the downside, a break of the $133 level could usher in a test of uptrend support (blue line), followed by the 61.8% retracement and rising 200-week moving average near $120.
Receive full access to real-time market analysis along with stock, commodities, and options trading recommendations. Sign up for Real Money Pro now.


