Could you use a spare $2,618? That’s how much money Chicago commuters lost due to the costs of being stuck in traffic.
Throughout the country, delay on the busiest U.S. corridors increased in 2022 along with congestion metro-wide, according to the latest traffic report by Inrix, a U.S. company that analyzes transportation data.
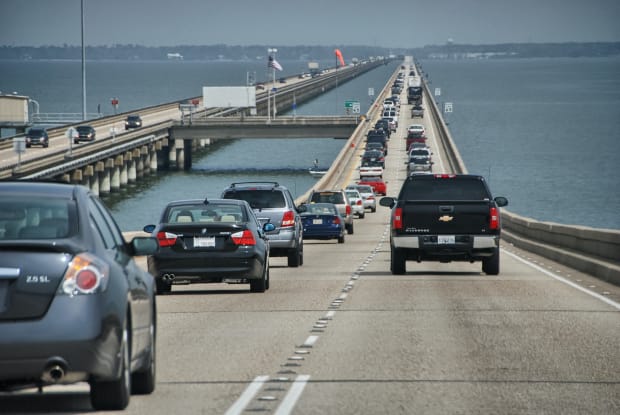
Anyone in Stamford, Conn., who drives on the 30-mile corridor on I-95 southbound from Sherwood Island Connector to Indian Field Road probably already has a pretty good idea of how much time they’ve lost to congestion -- an average of 34.5 minutes per day in lost time during the morning commute, and nearly as much on the northbound trip, Inrix says. This is the worst corridor in the U.S.
Not surprising that drivers on I-5 south in Los Angeles (or as they say, “the 5”) lost an average of 31.8 minutes a day in the afternoons. According to Inrix, a driver taking that route 240 workdays in 2022 would have lost 127 hours a year sitting in traffic.
Other notable corridors are I-93 southbound through downtown Boston to the Pilgrim Highway Interchange (99 hours lost annually) and westbound Brooklyn Queens Expressway to Tillary Street in New York City (91 hours lost).
Nationally, U.S. drivers spent 4.8 billion hours in congestion, and while that sounds awful, it’s less than the pre-pandemic 6 billion hours of 2019.
Traffic congestion cost the U.S. more than $81 billion in 2022. Inrix calculates the cost to cities add up to $9.5 billion for Chicago, $10.2 billion to New York, and $8.6 billion to Los Angeles.
Individually, a typical American driver lost 51 hours mired in traffic, costing an average of $869 in lost time, according to Inrix, and that doesn’t even include fuel costs. The average American driver spent $134 more on gas in 2022 than in 2021. A Los Angeles commuter shelled out nearly $315 more in 2022 than in 2021, and the typical New York driver an additional $213 in 2022.
To compile their Global Traffic Scorecard, Inrix collects billions of anonymous data points daily from a variety of sources, including connected vehicles, mobile devices, navigation units, fleet vehicles, road and garage infrastructure, and publicly available information on incidents for nearly 1,000 cities around the world.
These are the U.S. cities (plus Toronto) that had the worst traffic in the world in 2022.
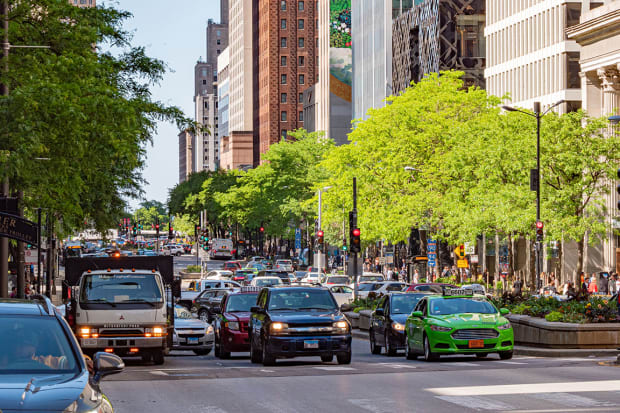
1. Chicago
- Hours lost per driver: 155
- Cost per driver: $2,618
- Downtown speed: 11 mph
- Global rank: 2
Besides being worst in the U.S. for traffic, Chicago ranks No. 2 in the world, behind London. See the worst cities in the world for traffic here.
4kclips / Shutterstock
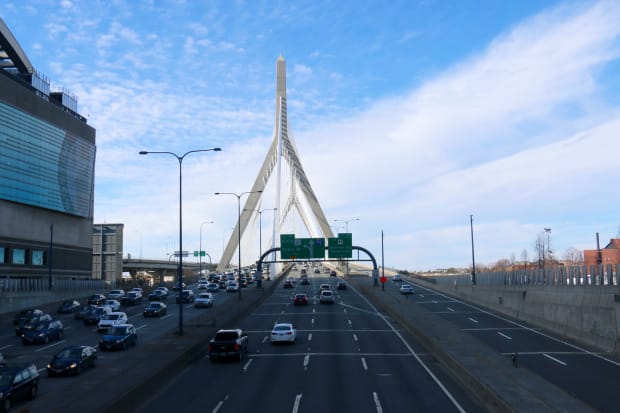
2. Boston
- Hours lost per driver: 134
- Cost per driver: $2,270
- Downtown speed: 11 mph
- Global rank: 4
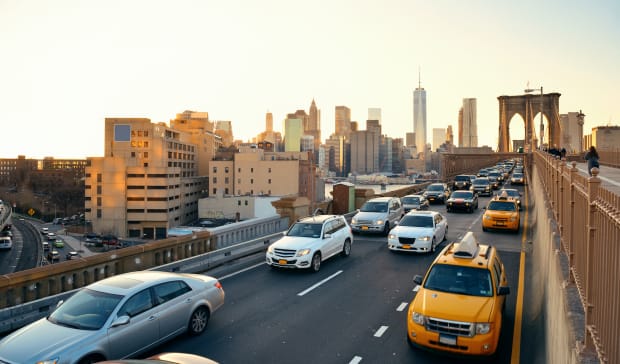
3. New York City
- Hours lost per driver: 117
- Cost per driver: $1,976
- Downtown speed: 11 mph
- Global rank: 5
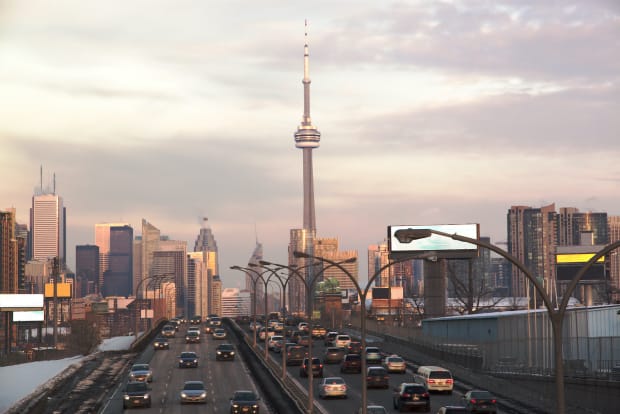
4. Toronto
- Hours lost per driver: 118
- Cost per driver: N/A
- Downtown speed: 10 mph
- Global rank: 7
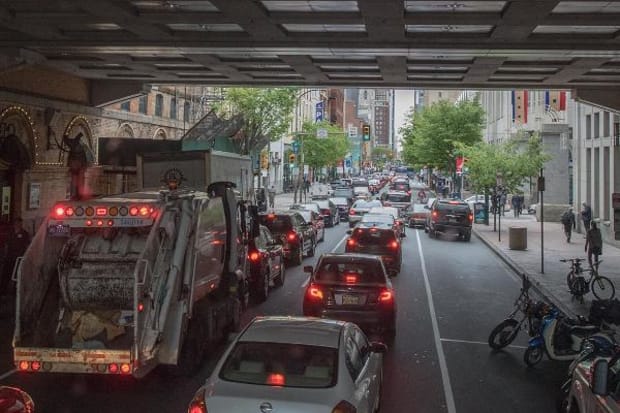
5. Philadelphia
- Hours lost per driver: 114
- Cost per driver: $1,925
- Downtown speed: 11 mph
- Global rank: 8
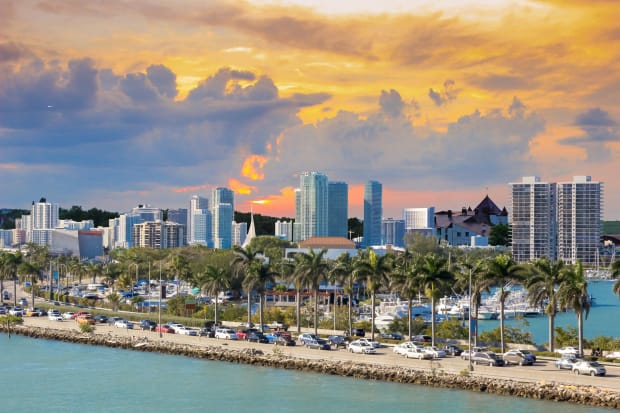
6. Miami
- Hours lost per driver: 105
- Cost per driver: $1,773
- Downtown speed: 15 mph
- Global rank: 9
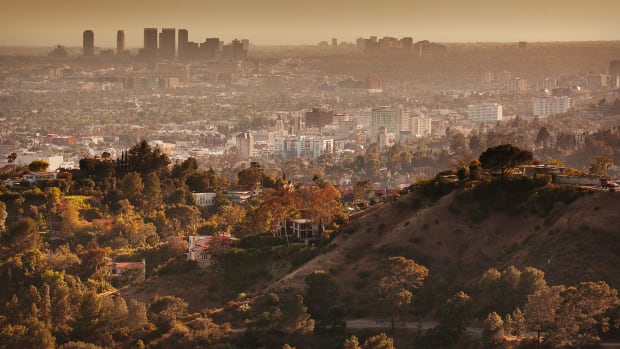
7. Los Angeles
- Hours lost per driver: 95
- Cost per driver: $1,601
- Downtown speed: 19 mph
- Global rank: 14
Getty Images
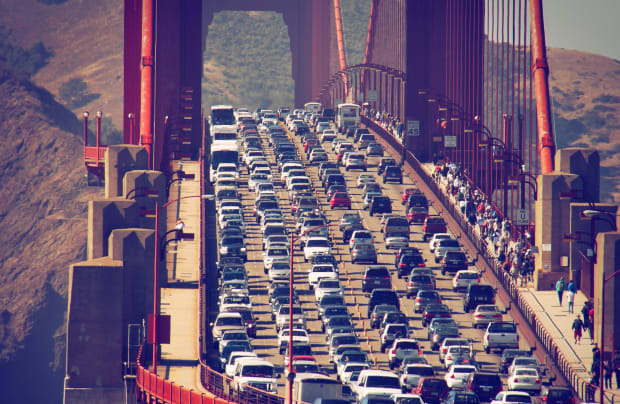
8. San Francisco
- Hours lost per driver: 97
- Cost per driver: $1,642
- Downtown speed: 12 mph
- Global rank: 15
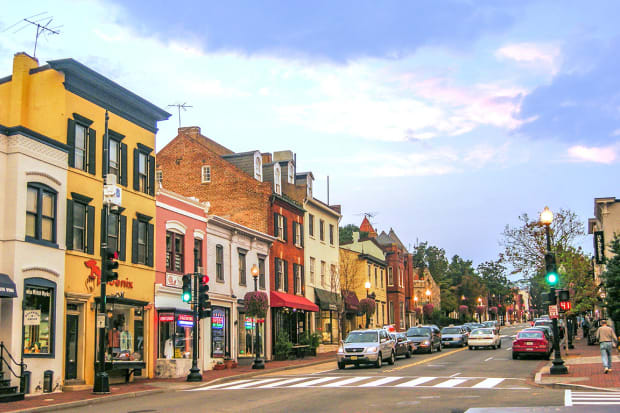
9. Washington D.C.
- Hours lost per driver: 83
- Cost per driver: $1,398
- Downtown speed: 11 mph
- Global rank: 20
Photo: DiegoMariottini / Shutterstock
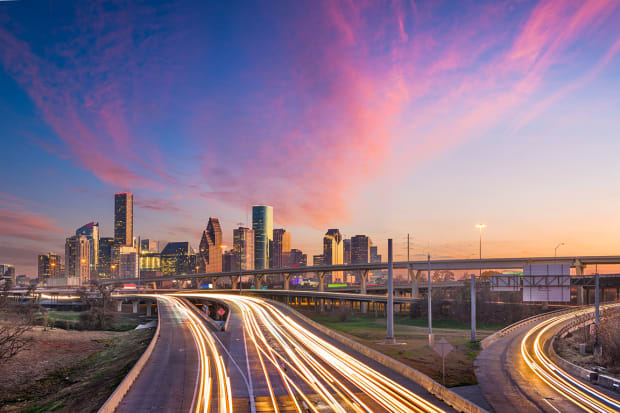
10. Houston, Texas
- Hours lost per driver: 74
- Cost per driver: $1,257
- Downtown speed: 16 mph
- Global rank: 27
Photo: Shutterstock
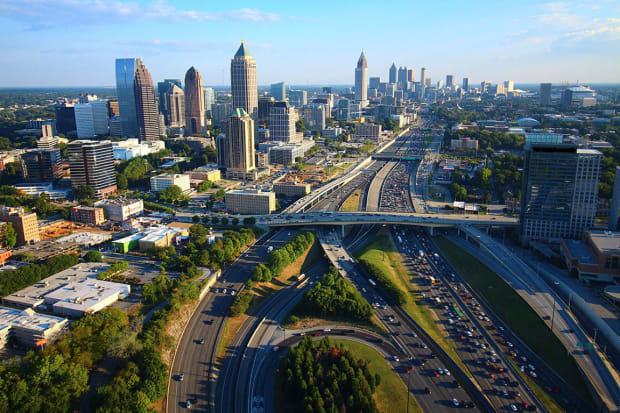
11. Atlanta
- Hours lost per driver: 74
- Cost per driver: $1,257
- Downtown speed: 16 mph
- Global rank: 28
12. New Orleans
- Hours lost per driver: 77
- Cost per driver: $1,297
- Downtown speed: 14 mph
- Global rank: 34
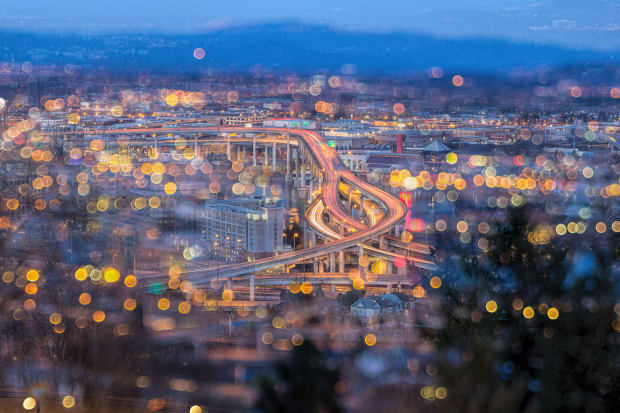
13. Portland, Ore.
- Hours lost per driver: 72
- Cost per driver: $$1,216
- Downtown speed: 15 mph
- Global rank: 37
Shutterstock

14. Stamford, Conn.
- Hours lost per driver: 73
- Cost per driver: $1,236
- Downtown speed: 13 mph
- Global rank: 42
Stamford is home to four of the worst traffic corridors in the U.S., all in the top 8. The worst is 1-95 south between Sherwood Island and Indian Field Road.
Shutterstock
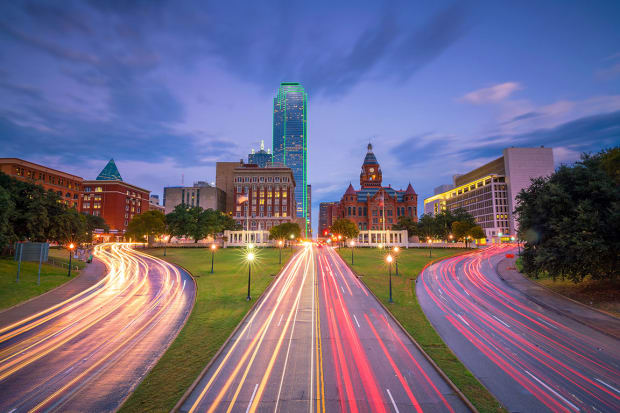
15. Dallas
- Hours lost per driver: 56
- Cost per driver: $953
- Downtown speed: 16 mph
- Global rank: 54
Shutterstock
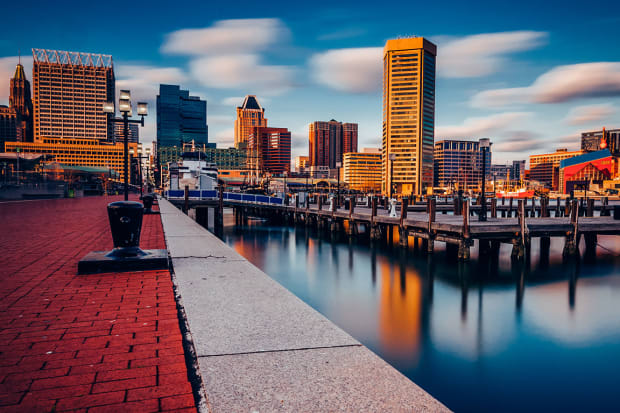
16. Baltimore
- Hours lost per driver: 55
- Cost per driver: $932
- Downtown speed: 12 mph
- Global rank: 63
Shutterstock
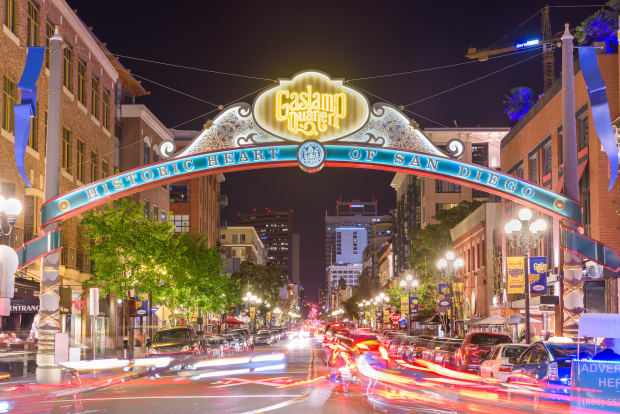
17. San Diego
- Hours lost per driver: 54
- Cost per driver: $912
- Downtown speed: 19 mph
- Global rank: 67
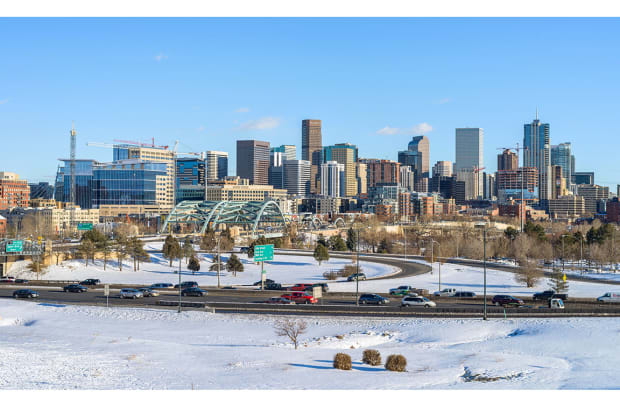
18. Denver
- Hours lost per driver: 54
- Cost per driver: $912
- Downtown speed: 14 mph
- Global rank: 69
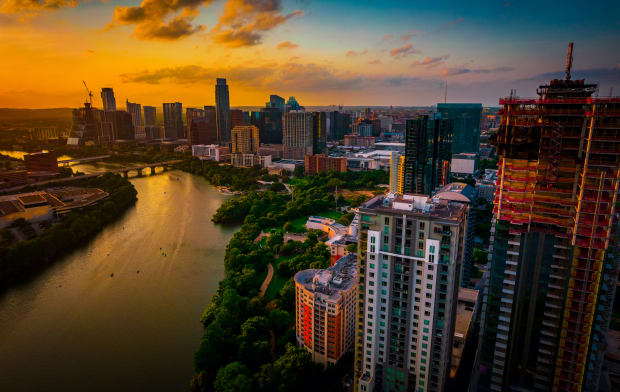
19. Austin, Texas
- Hours lost per driver: 53
- Cost per driver: $892
- Downtown speed: 17 mph
- Global rank: 80
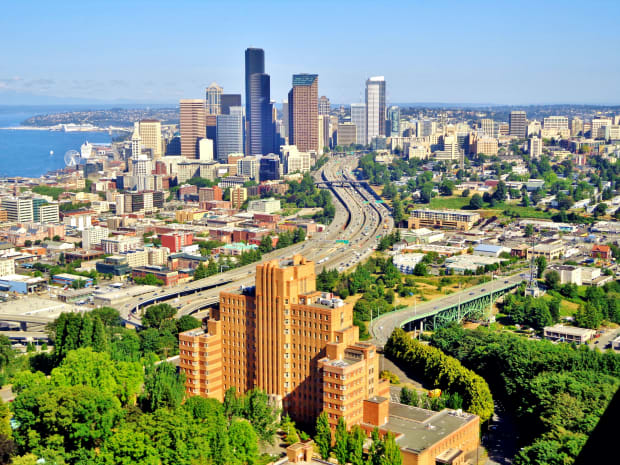
20. Seattle
- Hours lost per driver: 46
- Cost per driver: $770
- Downtown speed: 17 mph
- Global rank: 93
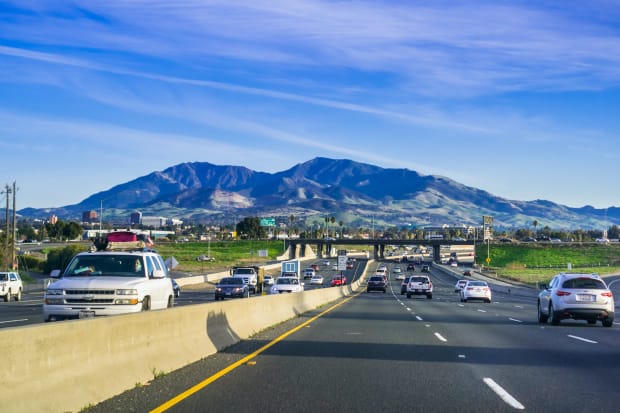
21. Concord, Calif.
- Hours lost per driver: 54
- Cost per driver: $912
- Downtown speed: 18 mph
- Global rank: 110
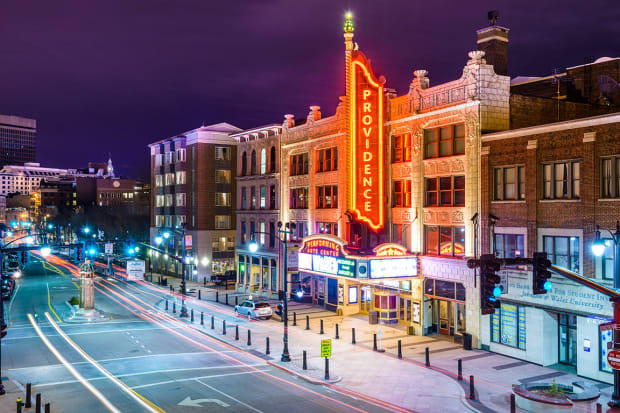
22. Providence R.I.
- Hours lost per driver: 42
- Cost per driver: $500
- Downtown speed: 14 mph
- Global rank: 124
ESB Professional / Shutterstock
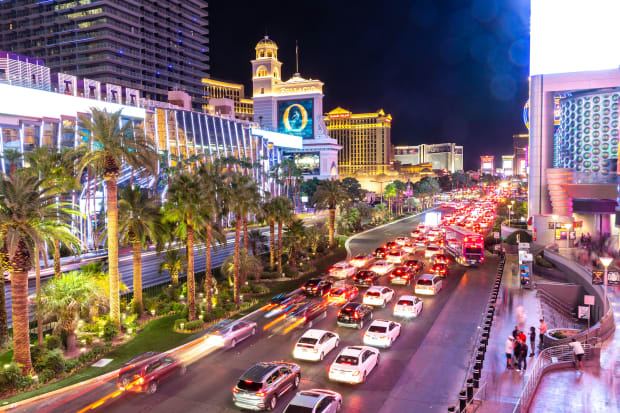
23. Las Vegas
- Hours lost per driver: 41
- Cost per driver: $689
- Downtown speed: 19 mph
- Global rank: 127
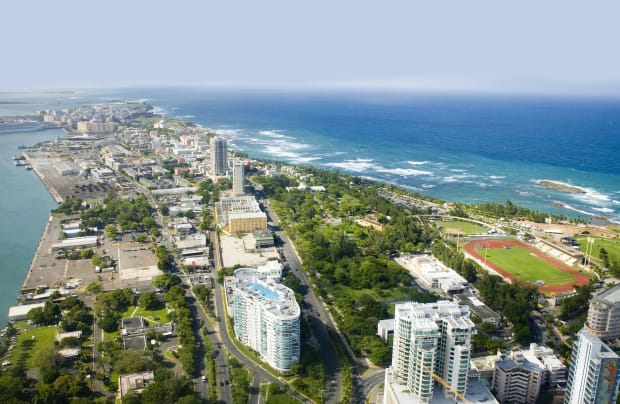
24. San Juan, Puerto Rico
- Hours lost per driver: 41
- Cost per driver: $689
- Downtown speed: 20 mph
- Global rank: 175
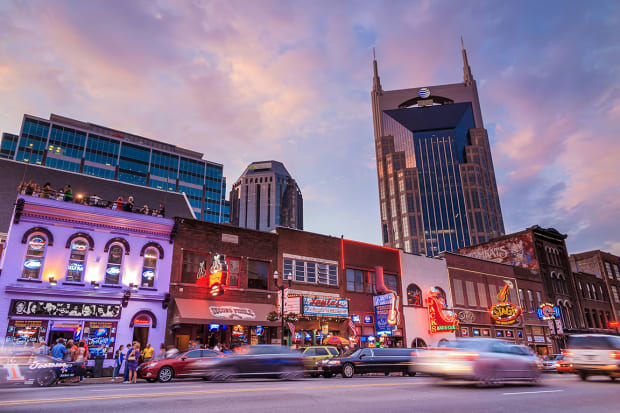
25. Nashville, Tenn.
- Hours lost per driver: 41
- Cost per driver: $689
- Downtown speed: 21 mph
- Global rank: 131
f11photo / Shutterstock
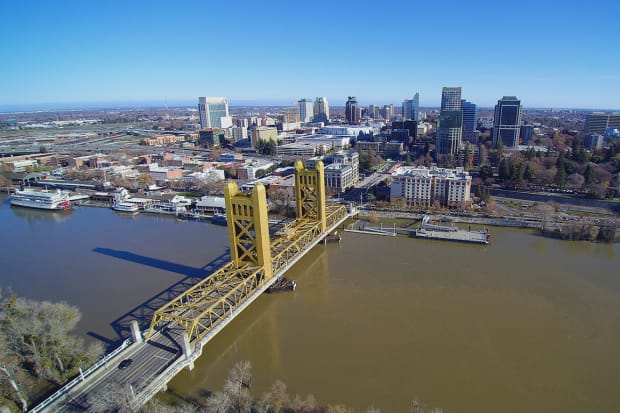
26. Sacramento, Calif.
- Hours lost per driver: 36
- Cost per driver: $608
- Downtown speed: 17 mph
- Global rank: 163
Shutterstock
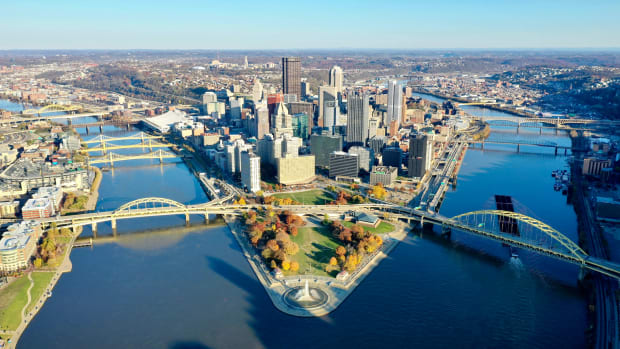
27. Pittsburgh
- Hours lost per driver: 34
- Cost per driver: $568
- Downtown speed: 19 mph
- Global rank: 192
Shutterstock
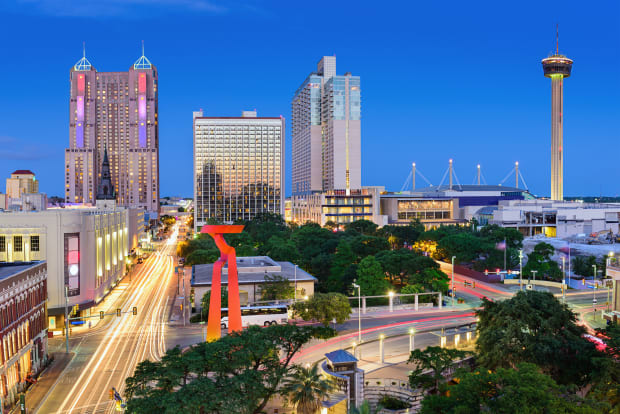
28. San Antonio, Texas
- Hours lost per driver: 32
- Cost per driver: $547
- Downtown speed: 18 mph
- Global rank: 204

29. Milwaukee
- Hours lost per driver: 32
- Cost per driver: $547
- Downtown speed: 18 mph
- Global rank: 211
30. Tampa, Fla.
- Hours lost per driver: 30
- Cost per driver: $507
- Downtown speed: 24 mph
- Global rank: 226