Jeff Curry/USA TODAY Sports
Welcome to The Opener, where every weekday morning during the regular season you’ll get a fresh, topical column to start your day from one of SI.com’s MLB writers.
The Mets are fighting mad. The baseballs are either dead, too slick, spending too much time in humidors or all of the above. The weather is too cold. It’s been a great month for conspiracy theorists but a lousy month for hitters.
There has never been a time in MLB history with fewer hits in the average game than right now (7.6 per team). Everybody has a theory. I’ll get to the conspiracy theories in a bit. But let’s stick to the facts. In order, here are the biggest reasons why offense is down:
1. The lockout
The short spring training prompted MLB to allow three more roster spots. Staffs of 16 pitchers are killing offense. (MLB will allow 14 pitchers through May before finally getting to the intended threshold of 13.)
When outs are divided among more pitchers, hitting suffers. That’s how deep the talent pool of pitching is—well, as long as the average max-out, strikeout-seeking, well-rested reliever has to throw only 18 pitches per appearance, anyway. Batting average (.220) and OBP (.303) against relievers are at all-time lows.
The highest OPS in matchups—hitters vs. starters a third time (.780 last year)—barely exists at all. Starting pitchers don’t have to pace themselves or face a lineup three times through. They are facing an average of only 2.8 hitters a third time, a 31% drop from 4.1 last year.
Fresh arms are everywhere. Relief pitchers are making only 14.1% of their appearances with no rest, down from 16.7% in April last year.
The batting average in innings seven through nine—just when the game should be exciting—is .224, an all-time worst by eight points.
The average game includes an all-time high of 9.32 pitchers. A decade ago, it was 7.98.
Juan Soto of the Nationals saw 46 different pitchers in his first 83 plate appearances. Ted Williams saw 73 pitchers in 606 plate appearances in the entire 1941 season.
More pitchers appeared in MLB games in the first three weeks this year than every full season from 1871 through 1994.
Folks, it’s right in front of you: The expanded inventory of arms is compromising the game.
2. Spin
For the first time in history, pitchers are throwing non-fastballs more than fastballs. Why? Follow the data:
2022 MLB hitting by pitch type
Remember when pitchers challenged rookies to see whether they could hit MLB velocity? Mariners rookie Julio Rodríguez is seeing only 39% fastballs. Corey Seager saw 53% fastballs when he was the 2016 NL Rookie of the Year. This year he sees only 39%. He’s hitting .179 against non-fastballs.
Pitch shaping is a newer phenomenon that has changed the game. Compared to 20 years ago, hitters swing less often at pitches in the strike zone (68% to 70%) and almost twice as often at pitches out of the zone (31% to 18%). Greg Maddux said the key to pitching is make the strikes look like balls and the balls look like strikes. It’s never been done more than right now.
3. Humidors
This is the first season with baseballs stored in humidors in all 30 ballparks. They are stored at 57% humidity (except at Coors Field, which is set at 65%). Atmospheric conditions tend to get more humid as the season goes on. For instance, April is the least humid month in New York (55%) and September the most (68%). MLB expects that the effect of keeping the baseballs in drier conditions will grow greater through the summer (i.e., a livelier ball). Stay tuned.
Jeff Curry/USA TODAY Sports
4. Everything else
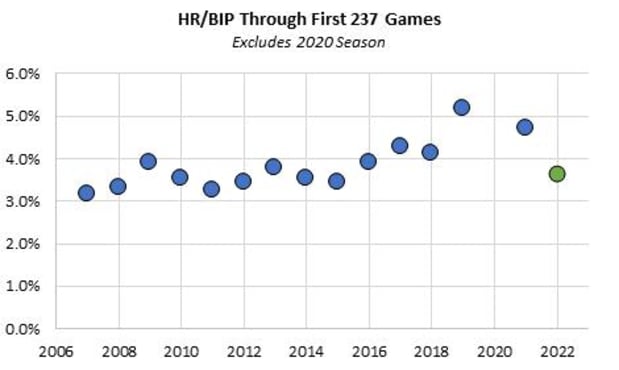
Cold weather. Infielders and outfielders playing deeper. Hitters trying to slug. (Opposite-field hitting is at its second-lowest rate this century. Only 2020 was worse, and the ground ball rate is the lowest this century.) The further evolution of tailored defensive shifts. (Batting average on balls in play is down a whopping 10 points from last year, hitting a 34-year low). All of it matters—just not as much as expanded pitching staffs. Like the humidor factor, we need more than three weeks (and not with bloated rosters) to see how it plays out.
And you might as well throw the baseball itself in there, as some players do. Now, about those conspiracies:
Theory: There is a hit-by-pitch epidemic in baseball.
Fact: The rate of hit by pitches per team game is the same as last year (0.43) and down from 2020 (0.46). The Pirates have yet to be hit by a pitch! The MLB average is seven per team so far.
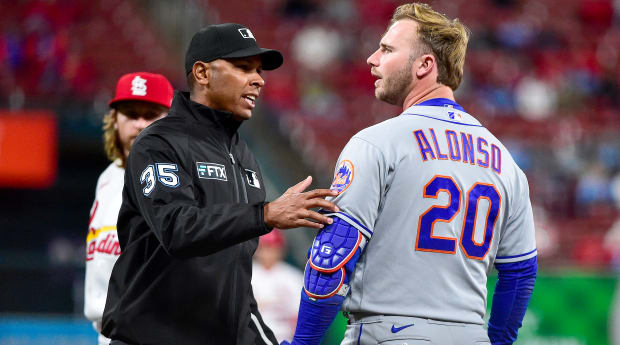
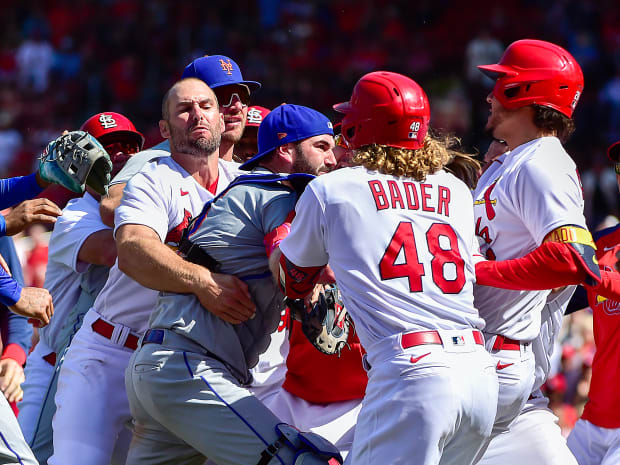
The “problem” is that the high-profile Mets are such an outlier (19 HBP in 20 games)—and they keep jumping out of the dugout with angry faces when it happens. New York retaliated Wednesday when Yoan López buzzed a fastball by the head of Nolan Arenado of the Cardinals after J.D. Davis left the game after getting hit on the ankle with a 3-and-2 pitch—clearly not an intentional pitch by St. Louis pitcher Génesis Cabrera. The Mets didn’t care about intent. They just got tired of seeing their guys plunked.
Theory: The Mets keep getting hit by pitches because pitchers can’t grip the ball in cold weather.
Fact: The 11 games in which the Mets have been hit by pitches have averaged 63.9 degrees at first pitch. The nine games in which they have not been hit have been colder, with an average temperature of 58.0 degrees.
Theory: Pitchers are targeting Mets hitters up and in.
Fact: It is common for pitchers to lose same-side sinkers on their arm side (i.e., a right-handed pitcher throwing a sinker in to a right-handed batter) because of the run on the pitch. Such pitches account for 21% of all hit by pitches, but 32% of the Mets’ hit by pitches. The Mets have an abundance of hitters who pitchers must attack on the inside part of the plate. Three of them show up on the list of most hit by pitches over the past four seasons:
Most HBP, 2019–22
Nobody should be surprised that the Mets get hit with a lot of pitches.
Theory: The crackdown on sticky substances made the game more dangerous for hitters.
Fact: The hit-by-pitch rate remained flat once the crackdown unofficially began:
Hit by pitches per team game, 2021
Theory: It’s wilder than ever out there on the mound.
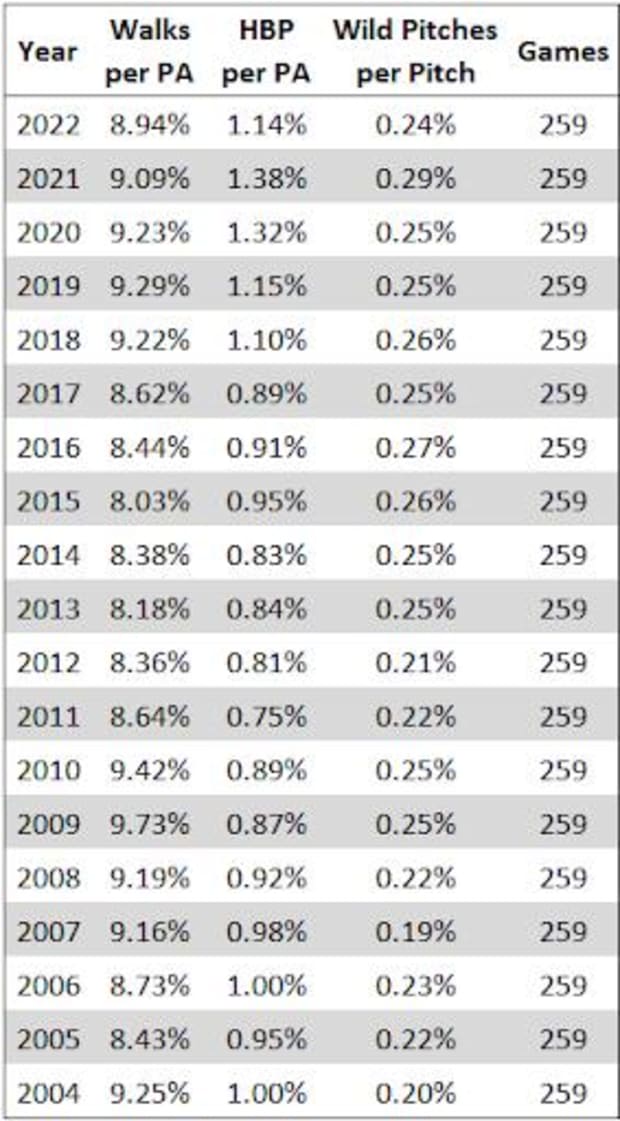
Fact: Walks, hit by pitches and wild pitches are at four-year lows through 259 games (slightly). The rise in hit batters started in 2018 as technology prompted pitchers to chase speed, spin and strikeouts. This season is not unusual. It fits right in with this era of more pitchers using more spin:
Theory: MLB is mixing batches of baseballs.