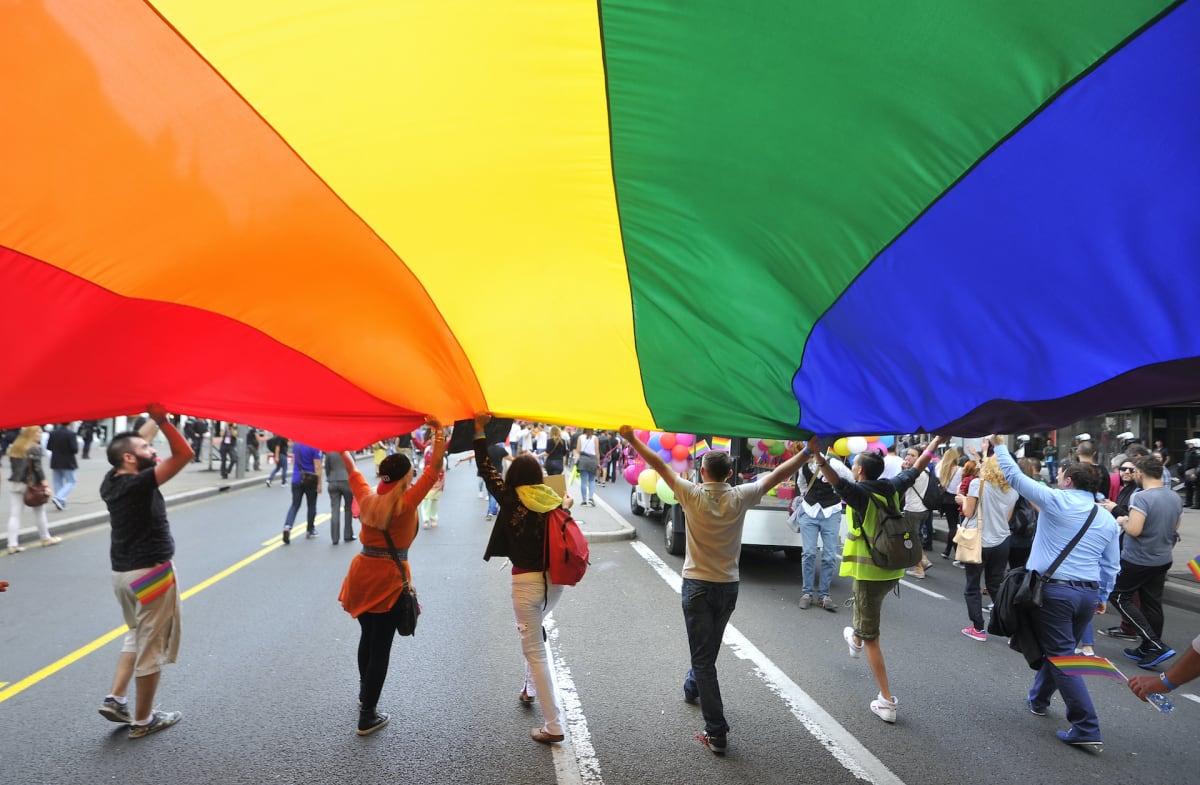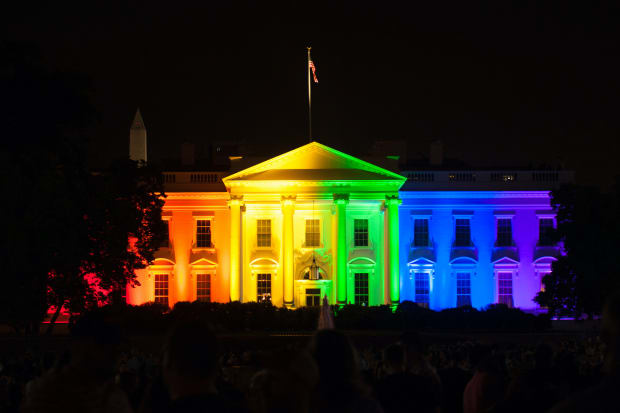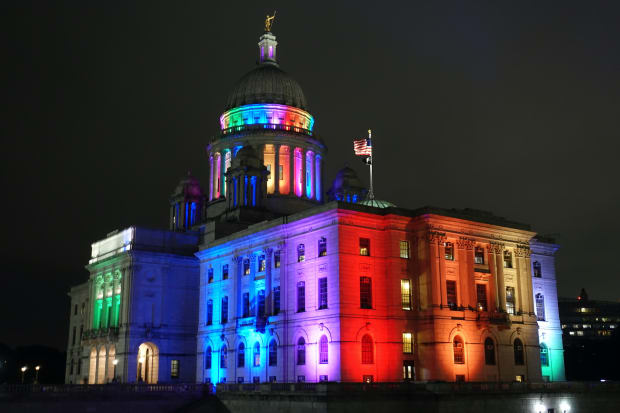
In 2015, the U.S. Supreme Court ruled in a landmark case that same-sex couples had the fundamental right to marriage in all states. There are currently 34 countries in the world where same-sex marriage is legal, according to the Human Rights Campaign.
But despite a movement to improve the rights of lesbian, gay, bisexual and transgender (LGBTQ) people around the world, there’s been a backlash in the U.S., with a record number of anti-LGBTQ bills introduced in state legislatures so far in 2023 -- more than double that of all of 2022, CNN reports. The American Civil Liberties Union is currently tracking 471 anti-LGBTQ bills in the U.S. as of May 2.
Some of these laws, according to the ACLU, allow employers, businesses, and even hospitals to turn away LGBTQ Americans or refuse them equal treatment; restrict how and when LGBTQ people can be themselves; prohibit transgender people from using facilities like public bathrooms and locker rooms or from participating in school activities like sports; and force teachers to 'out' students and censor in-school discussions of LGBTQ people and issues.
The Movement Advancement Project, (MAP) an independent, nonprofit think tank that provides research, insight, and communications with the goal of equality and opportunity for all, tracks and scores over 50 different LGBTQ-related laws and policies in detail in all 50 states, D.C. and territories.
Less than half-- about 43% -- of LGBTQ Americans live in states with policies that, overall, protect their rights, according to MAP’s Equality Snapshot: LGBTQ Equality By State. Some 11% live in states with overall negative policies that restrict LGBTQ rights.
MAP reviews these policies and assigns a point value, then adds these scores to create a "policy tally" for each state. The policy tally is divided into categories (negative, low, fair, medium, and high) to provide a snapshot of the overall LGBTQ policy climate across the country.
The major categories of laws covered by MAP’s policy tally include:
- Relationship and parental recognition
- Nondiscrimination
- Religious exemptions
- LGBTQ youth
- Health care
- Criminal justice
- Identity documents
Harmful or discriminatory policies earn negative points or point deductions, while LGBTQ-inclusive or protective laws earn positive points. States that have enacted a portion of a law, or where local laws provide some protection but do not cover the entire state, may have earned fractions of a point.
This list shows the states with the highest and lowest scores in MAP’s overall tally, and also includes the individual scores for those states' policies on sexual orientation (loosely defined as a person’s pattern of emotional, romantic, or sexual attraction) and gender identity (a person's deeply-felt inner sense of their own gender, including being male, female, or something else.)
Here are the 20 states with the highest scores for protecting LGBTQ rights, followed by the nine states with the worst scores.

1. California
Overall score: 41.75 (out of 42.5) (high score)
- Sexual orientation policy score: 20 (out of 20.5) (high score)
- Gender identity score: 21.75 (out of 22) (high score)

2. Colorado
Overall score: 41.5 (high score)
- Sexual orientation policy score: 20.25 (high score)
- Gender identity score: 21.25 (high score)

3. Nevada
Overall score: 40.5 (high score)
- Sexual orientation policy score: 20 (high score)
- Gender identity score: 20.5 (high score)

4. Maine
Overall score: 39.5 (high score)
- Sexual orientation policy score: 19 (high score)
- Gender identity score: 20.5 (high score)

5. New York
Overall score: 39.5 (high score)
- Sexual orientation policy score: 18.5 (high score)
- Gender identity score: 21.0 (high score)

6. New Jersey
Overall score: 38.5 (high score)
- Sexual orientation policy score: 17.5 (high score)
- Gender identity score: 21.0 (high score)
Shutterstock

7. Connecticut
Overall score: 38.0 (high score)
- Sexual orientation policy score: 18 (high score)
- Gender identity score: 20.0 (high score)

8. District of Columbia
Overall score: 37.5 (high score)
- Sexual orientation policy score: 18 (high score)
- Gender identity score: 19.5 (high score)

9. Oregon
Overall score: 37.5 (high score)
- Sexual orientation policy score: 17.5 (high score)
- Gender identity score: 20.0 (high score)

10. Vermont
Overall score: 37.5 (high score)
- Sexual orientation policy score: 18 (high score)
- Gender identity score: 19.5 (high score)

11. Washington
Overall score: 37.25 (high score)
- Sexual orientation policy score: 17.25 (high score)
- Gender identity score: 20.0 (high score)

12. Illinois
Overall score: 36.5 (high score)
- Sexual orientation policy score: 18 (high score)
- Gender identity score: 18.5 (high score)
Joseph Sohm / Shutterstock

13. Massachusetts
Overall score: 35.0 (high score)
- Sexual orientation policy score: 17.5 (high score)
- Gender identity score: 17.5 (high score)

14. Minnesota
Overall score: 34.5 (high score)
- Sexual orientation policy score: 15.5 (high score)
- Gender identity score: 19.0 (high score)

15. Hawaii
Overall score: 33.5 (high score)
- Sexual orientation policy score: 16 (high score)
- Gender identity score: 17.5 (high score)

16. Rhode Island
Overall score: 33.0 (high score)
- Sexual orientation policy score: 16 (high score)
- Gender identity score: 17.0 (high score)

17. New Mexico
Overall score: 31.0 (high score)
- Sexual orientation policy score: 14 (medium score)
- Gender identity score: 17.0 (high score)

18. Maryland
Overall score: 30.75 (high score)
- Sexual orientation policy score: 13.75 (medium score)
- Gender identity score: 17.0 (high score)
Shutterstock

19. New Hampshire
Overall score: 29.5 (high score)
- Sexual orientation policy score: 15 (medium score)
- Gender identity score: 14.5 (medium score)
Shutterstock

20. Delaware
Overall score: 29.0 (medium score)
- Sexual orientation policy score: 13.75 (medium score)
- Gender identity score: 15.25 (medium score)

21. Virginia
Overall score: 25.5 (medium score)
- Sexual orientation policy score: 11 (medium score)
- Gender identity score: 14.5 (medium score)
Nine states received negative overall scores in MAP's equality by state comparison. Harmful or discriminatory policies that specifically target LGBTQ people and/or restrict access to rights, services, or programs for LGBTQ people earn negative points or point deductions. For example, negative laws that specifically target LGBTQ Americans are “Don’t Say Gay” laws that explicitly prohibit educators from discussing LGBTQ issues or people in a positive manner or from mentioning LGBTQ people at all in schools.
Here are the nine states with the negative scores:

1. Tennessee
Overall score: -10.5 (negative score)
- Sexual orientation policy score: -1.75 (negative score)
- Gender identity score: -8.75 (negative score)
Tennessee has the lowest score of all 50 states. According to MAP, there are 233,000 LGBTQ Americans in Tennessee and 4% of the workforce is LGBTQ.
Tennessee has banned local governments from passing ordinances that prohibit discrimination based on both sexual orientation and gender identity. Tennessee is the only state with a law restricting drag performances. You can see the details of MAP's equality profile of Tennessee here.
Shutterstock

2. Alabama
Overall score: -9.5 (negative score)
- Sexual orientation policy score: -2 (negative score)
- Gender identity score: -7.5 (negative score)
Sean Pavone / Shutterstock

3. Arkansas
Overall score: -8.0 (negative score)
- Sexual orientation policy score: -1.5 (negative score)
- Gender identity score: -6.5 (negative score)

4. South Dakota
Overall score: -5.5 (negative score)
- Sexual orientation policy score: -0.5 (negative score)
- Gender identity score: -5.0 (negative score)

5. Mississippi
Overall score: -4.0 (negative score)
- Sexual orientation policy score: 0.0
- Gender identity score: -4.0 (negative score)

6. Oklahoma
Overall score: -4.0 (negative score)
- Sexual orientation policy score: 2.0 (low score)
- Gender identity score: -6.0 (negative score)
Shutterstock

7. Louisiana
Overall score: -3.5 (negative score)
- Sexual orientation policy score: 1.0 (low score)
- Gender identity score: -4.50 (negative score)

8. South Carolina
Overall score: -2.5 (negative score)
- Sexual orientation policy score: 2.0 (low score)
- Gender identity score: -4.5 (negative score)

9. Georgia
Overall score: -0.5 (negative score)
- Sexual orientation policy score: 2.0 (low score)
- Gender identity score: -2.5 (negative score)
You can see the full ranking of all 50 states along with D.C., American Samoa, U.S. Virgin Islands, Guam and Puerto Rico at the Movement Advancement Project.
Shutterstock


