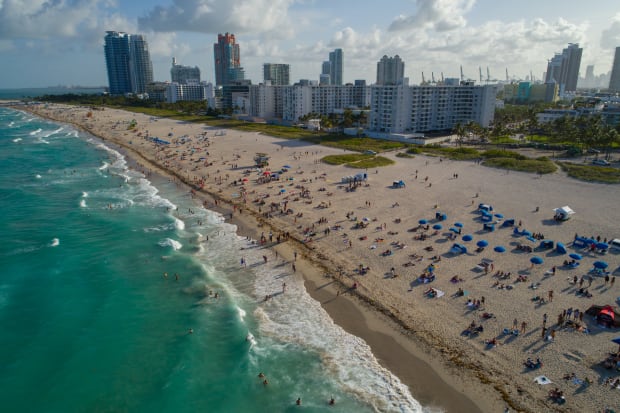
Hurricane season started June 1, and the National Oceanic and Atmospheric Administration predicts 12-17 named storms in 2023, of which one to four could become major, with winds over 111 mph.
Last year's hurricane season produced 14 named storms, eight became hurricanes with winds of 74 mph or greater, and two intensified to major hurricanes with winds reaching over 111 mph, including hurricane Ian.
Hurricane Ian did more than $100 billion in damages to Florida, and a whopping 2.5 million people were ordered to evacuate.
Unfazed, and drawn to Florida's otherwise mild weather and low cost of living, people continue to move to the sunny state at a rapid rate, making Florida the fastest-growing state in the country for the first time since 1957.
Net domestic migration is the total number of people moving in and out of an area. According to the U.S. Census Bureau, in 2022, 26 states experienced an influx of people, with more people moving in than out, while 25 states lost movers, according to an analysis of the data by the National Association of Realtors.
While millions of people moved during the pandemic, the moving rate in the U.S. has declined for the last six years, NAR says. Nearly 70% of the ZIP codes across the U.S. experienced fewer inbound moves in 2022 compared to 2021, U.S. Postal Service change-of-address data showed.
NAR crunched the Census Bureau’s net migration data to determine the states where people are moving to most, and the states people are leaving overall. Here are all 50 states and D.C. in order of highest to lowest net migration, by percentage.

1. Florida
- 2022 net migration: +318,855
- 2021-2022 population change: +1.9%
For areas with more than 150,000 households, areas in Florida including Ocala, Tallahassee, Deltona and Miami were among the 10 cities in the nation with the highest inbound move rates in 2022, at over 55%, according to USPS data.

2. Idaho
- 2022 net migration: +28,639
- 2021-2022 population change: +1.8%
The Boise area had an inbound move rate of 47.6% in 2022.
Checubus / Shutterstock

3. South Carolina
- 2022 net migration: +84,030
- 2021-2022 population change: +1.7%
Myrtle Beach and the Charlotte metro area, which spills over the North Carolina border into South Carolina, were among the 10 U.S. metro areas with 2022 inbound move rates over 55%.
Shutterstock

4. Texas
- 2022 net migration: +230,961
- 2021-2022 population change: +1.6%
McAllen, Texas had the 10th highest inbound move rate in 2022 at 55.1%. The Austin, Corpus Christi and San Antonio areas were also above 50%.
Shutterstock

5. South Dakota
- 2022 net migration: +8,424
- 2021-2022 population change: +1.5%
Shutterstock

6. Montana
- 2022 net migration: +16,003
- 2021-2022 population change: +1.5%

7. Delaware
- 2022 net migration: +11,826
- 2021-2022 population change: +1.4%

8. Arizona
- 2022 net migration: +70,984
- 2021-2022 population change: +1.3%
iStock

9. North Carolina
- 2022 net migration: +99,796
- 2021-2022 population change: +1.3%

10. Utah
- 2022 net migration: +12,898
- 2021-2022 population change: +1.2%
Three metros in Utah had inbound move rates in 2022 of more than 46%: Salt Lake, Provo and Ogden.
Shutterstock

11. Tennessee
- 2022 net migration: +81,646
- 2021-2022 population change: +1.2%

12. Georgia
- 2022 net migration: +81,406
- 2021-2022 population change: +1.2%
Savannah, Georgia was another of the 10 cities with the highest 2022 inbound move rate at 55.8%.
Shutterstock

13. Nevada
- 2022 net migration: +20,781
- 2021-2022 population change: +1%
Shutterstock

14. Oklahoma
- 2022 net migration: +26,791
- 2021-2022 population change: +0.7%

15. Maine
- 2022 net migration: +11,600
- 2021-2022 population change: +0.6%

16. Washington
- 2022 net migration: -3,580
- 2021-2022 population change: +0.6%

17. Arkansas
- 2022 net migration: +18,209
- 2021-2022 population change: +0.6%

18. New Hampshire
- 2022 net migration: +6,303
- 2021-2022 population change: +0.6%
Shutterstock

19. Colorado
- 2022 net migration: +5,376
- 2021-2022 population change: +0.5%

20. Alabama
- 2022 net migration: +28,609
- 2021-2022 population change: +0.5%

21. District of Columbia
- 2022 net migration: -3,647
- 2021-2022 population change: +0.5%

22. Wyoming
- 2022 net migration: +2,152
- 2021-2022 population change: +0.3%

23. Virginia
- 2022 net migration: -23,952
- 2021-2022 population change: +0.3%
Shutterstock

24. Indiana
- 2022 net migration: +5,230
- 2021-2022 population change: +0.3%

25. Nebraska
- 2022 net migration: -4,270
- 2021-2022 population change: +0.2%

26. Wisconsin
- 2022 net migration: +7,657
- 2021-2022 population change: +0.2%

27. North Dakota
- 2022 net migration: -2,710
- 2021-2022 population change: +0.2%

28. Missouri
- 2022 net migration: +5,024
- 2021-2022 population change: +0.1%

29. Kentucky
- 2022 net migration: +10,420
- 2021-2022 population change: +0.1%
Shutterstock

30. Minnesota
- 2022 net migration: -19,400
- 2021-2022 population change: +0.1%
Shutterstock

31. lowa
- 2022 net migration: -7,292
- 2021-2022 population change: +0.1%

32. Connecticut
- 2022 net migration: -13,547
- 2021-2022 population change: +0.1%

33. Vermont
- 2022 net migration: +1,141
- 2021-2022 population change: 0.0%

34. Kansas
- 2022 net migration: -7,409
- 2021-2022 population change: 0.0%

35. Michigan
- 2022 net migration: -8,482
- 2021-2022 population change: 0.0%
The following states had a negative net migration:

36. New Jersey
- 2022 net migration: -64,231
- 2021-2022 population change: -0.1%

37. Ohio
- 2022 net migration: -9,165
- 2021-2022 population change: -0.1%

38. Alaska
- 2022 net migration: -6,126
- 2021-2022 population change: -0.1%

39. Massachusetts
- 2022 net migration: -57,292
- 2021-2022 population change: -0.1%

40. New Mexico
- 2022 net migration: -4,504
- 2021-2022 population change: -0.2%

41. Maryland
- 2022 net migration: -45,101
- 2021-2022 population change: -0.2%

42. California
- 2022 net migration: -343,230
- 2021-2022 population change: -0.3%

43. Rhode Island
- 2022 net migration: -5,196
- 2021-2022 population change: -0.3%
Ritu Manoj Jethani / Shutterstock

44. Pennsylvania
- 2022 net migration: -39,957
- 2021-2022 population change: -0.3%
Shutterstock

45. Mississippi
- 2022 net migration: -5,716
- 2021-2022 population change: -0.3%
Shutterstock

46. Oregon
- 2022 net migration: -17,331
- 2021-2022 population change: -0.4%

47. Hawaii
- 2022 net migration: -15,212
- 2021-2022 population change: -0.5%
Shutterstock

48. West Virginia
- 2022 net migration: +474
- 2021-2022 population change: -0.6%

49. Louisiana
- 2022 net migration: -46,672
- 2021-2022 population change: -0.8%

50. Illinois
- 2022 net migration: -141,656
- 2021-2022 population change: -0.8%

51. New York
- 2022 net migration: -299,557
- 2021-2022 population change: -0.9%


