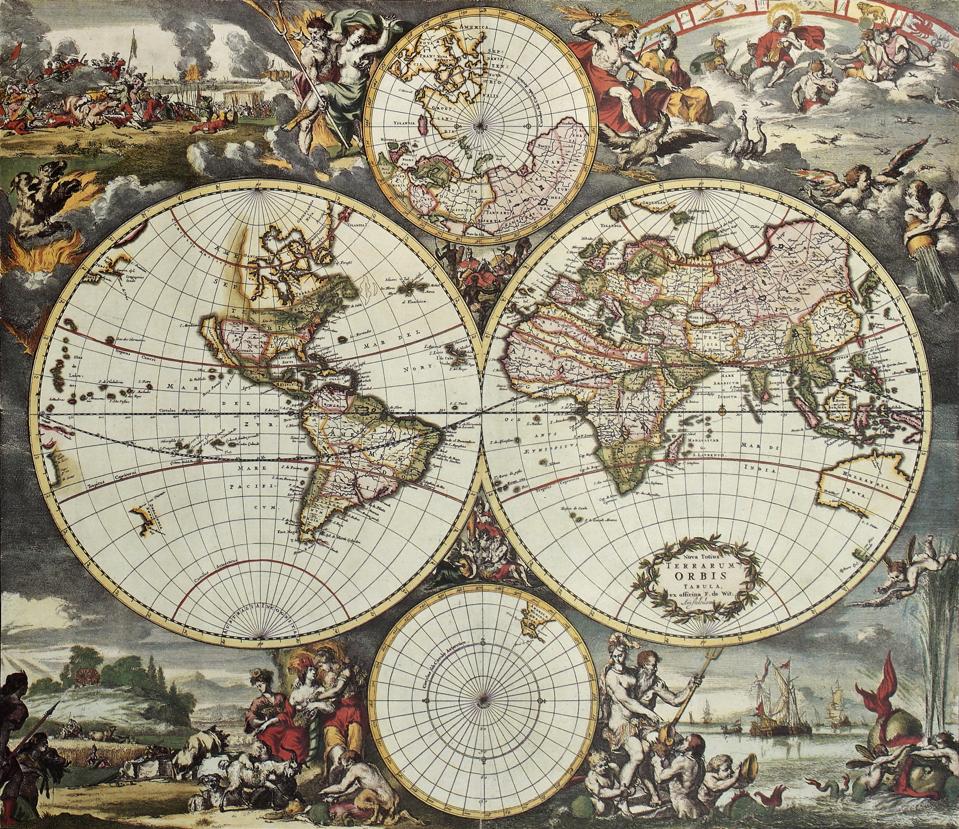
When we think about visualizing history, we typically think in terms of either historical imagery or geographic maps. Maps are an especially powerful lens through which to understand history, connecting our world through one of its two fundamental organizing dimensions. Yet, what would history look like without the dimension of space and what can we learn about how Wikipedia organizes world history through the dimension of time?
The timeline below shows the results of processing the entire English language Wikipedia circa-2012 to extract every textual reference to a date from 1001 AD to 2011. The Y axis counts the total number of mentions of dates in each year over the past 1,000 years.

Immediately clear is that the so-called “copyright gap” that decimates analyses based on digitized material does not affect Wikipedia’s user-contributed history of the world.
Similarly clear is that the overwhelming majority of Wikipedia’s history relates to just the last 200 years and especially the born-digital era of the past few decades.
The graph below plots the same timeline, but on a logarithmic scale, making its macro temporal patterns more visible.

World history through the eyes of Wikipedia can be seen to fall into four major periods.
The First Era Of Wikipedia’s History runs from 1001-1500, corresponding roughly to the Middle Ages and characterized by fairly steady mentions with only modest growth over time.
The Second Era Of Wikipedia’s History runs from 1501-1729, corresponding roughly to the Early Modern Period starting around the late Renaissance. This period shows steady year-over-year growth in the amount of knowledge recorded in Wikipedia over time.
The Third Era Of Wikipedia’s History runs from 1730 to 2003, corresponding to the start of the Age of Enlightenment and shows a sharp exponentially accelerating rate of knowledge recording, as more and more events from each year are preserved.
Finally, the Fourth Era Of Wikipedia’s History, which could also be labeled as The Wikipedia Era, begins with the rise of Wikipedia itself. During this era the level of detail preserved about global events each year surges almost vertically, showing the impact of having a single centralized repository for users across the world to contribute to.
Zooming into the most recent half century, one troubling phenomena emerges: the leveling off of information contribution.

It seems that from 2007-2009, the growth in mentions of any given year on the English Wikipedia leveled off.
Does this represent some form of “peak knowledge” in which Wikipedia is recording all there is to know about the planet each year?
An intriguing explanation may be seen in the graph below, plotting the total number of articles in the English edition of Wikipedia 2001-2011 against the total number of mentions of dates from that year across the textual contents of those articles.

The year 2007 marked an inflection point where there were as many mentions of that year circa-2012 as there were articles in Wikipedia that year.
Since that year, the total article count of Wikipedia continued to grow through 2012, while the number of mentions of dates in each year leveled off.
This suggests that Wikipedia’s growth transitioned in 2007 from increasing coverage of the present to reinforcement and enrichment of the past.
Wikipedia’s contributors are no longer spending all of their efforts live-documenting the present, but rather spending an ever-greater amount of time looking to the past to fill in the encyclopedia’s gaps.
This also suggests that the 1.7-1.9 million mentions of each new year that Wikipedia appears to have leveled off at as of 2012 reflects some sort of deeper societal barometer of how many events occur each year that are deemed worthy of inclusion by the English-speaking contributors of Wikipedia.
Without maps, this is all of Wikipedia’s history that we would see. Just a set of timelines charting various indicators, but no understanding of how all of these dates are connected in space.
When we add the dimension of space, suddenly the timelines above become the powerful visualization below showing how all of the places on earth have been connected through the eyes of Wikipedia over time.
Putting this all together, we see that Wikipedia’s view of global history over the past thousand years falls into four eras roughly corresponding to major eras of human history, while its most recent era is linked to Wikipedia itself. Through 2012, Wikipedia’s live chronicle of humanity appears to have leveled off at around 1.7 to 1.9 million mentions of each new year, suggesting this reflects some kind of fundamental number about what Wikipedia’s English speaking contributors view as the total number of noteworthy events each year.
In the end, however, perhaps the most striking aspect of these timelines is the reminder of just how important geography is to our understanding of history and that without maps all we would understand of our history at scale would be time.