It’s a tale of two telecoms, as one stock continues to perform well and the other continues to stagnate. As the headline would suggest, we’re talking about AT&T (T) and T-Mobile (TMUS).
AT&T continues to struggle, down 9% so far this year, while T-Mobile continues to trade quite well, up 22.5% so far this year.
Think that’s bad? Look at this stat: AT&T shares are down 38.8% from the 52-week high, while T-Mobile stock is down just 3.3% from its all-time high.
Investors can argue until they’re blue in the face, but in the stock market, just one thing pays and that’s price. Simply put, either the stock is going up or it's going down.
It goes beyond stock prices, though. AT&T reported disappointing guidance in July, while T-Mobile reported solid results.
The juicy 6.5% dividend yield at AT&T is nice, but at what cost? It lacks momentum in its business and on the charts.
The Problem With AT&T Stock
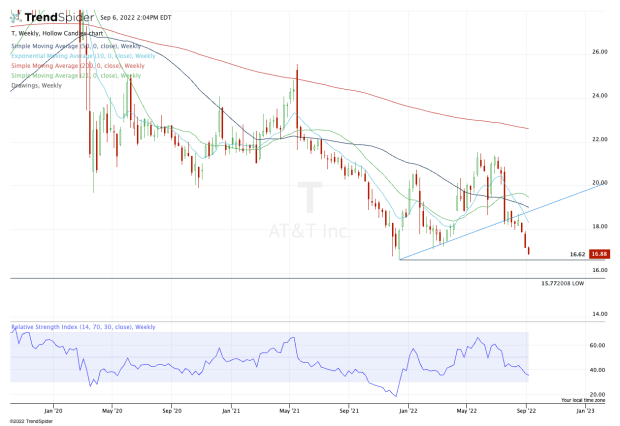
Chart courtesy of TrendSpider.com
AT&T stock is working on its third straight weekly decline and its eighth weekly decline in the last 10 weeks.
Once the $18 level gave way, that was the line in the sand that told bullish traders to change their tune and bail. Now below all of its key moving averages, AT&T stock is barreling toward its multi-year low of $16.62.
Despite how terrible the chart looks, this could be a reasonable risk/reward level for interested buyers. That’s particularly true if AT&T breaks below this measure, hits a new low and then reclaims $16.62.
If it does that, then we have a level to measure our risk against: the new 52-week low.
That said, this is not a healthy chart. The only momentum it has is bearish and the market is clearly voting on the telecom stock that it likes, which is T-Mobile.
Trading T-Mobile Stock
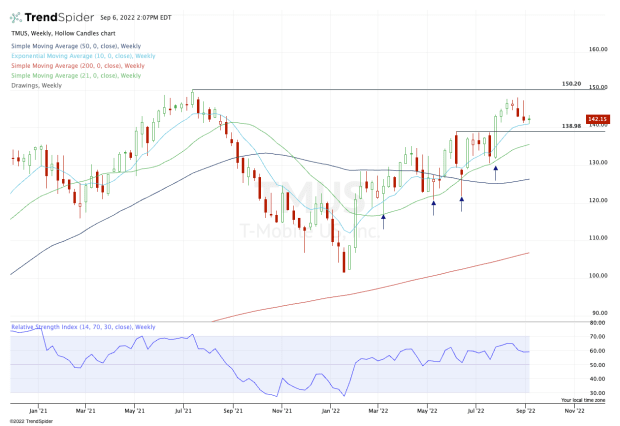
Chart courtesy of TrendSpider.com
As we look at the charts for T-Mobile stock, notice how the trend is completely different. It’s putting in a series of higher lows and continues to ride its 10-week and 21-week moving averages higher.
Recently, T-Mobile has begun to struggle with the $147.50 to $148 area and was rejected from this zone in four straight weeks.
It’s still early in the week, but today’s reaction to the 10-week moving average is good. More specifically though, buyers may be interested in T-Mobile stock in the $139 to $141 zone.
In that area, we find a big breakout area, as well as the 10-week and 50-day moving averages.
If these measures hold, the trend remains intact and bulls can stay long. On the upside, look for $147.50 to $148 as resistance, but more specifically, $150-plus is what bulls want to see.