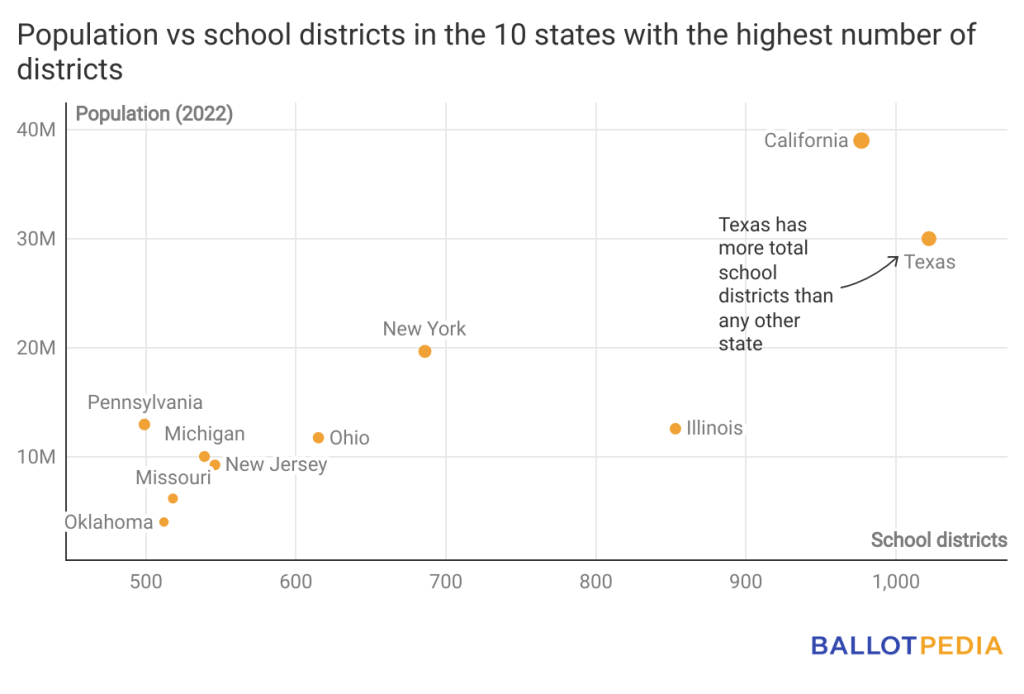
While California enrolls the largest population of public school students in the country, Texas has the most school districts and elected board members. There are 1,022 school districts in the Lone Star State and 6,994 elected board members.
This year, Ballotpedia will cover elections for 172 Texas school board seats. One-hundred and fifty of those elections were on the ballot on May 6, allowing some initial analysis related to the state’s school board election trends. The remaining districts will hold elections in November. Here’s what Ballotpedia found related to candidates filing per seat and incumbent success rates.
- If the volume of candidates filing for seats in November matches the May numbers, Texas will continue to see a higher number of candidates per seat in odd-numbered years than in even-numbered years.
- Texas school board elections tend to see more candidates file per seat in odd-numbered years than in even-numbered years. Between 2018 and 2023, odd-numbered election years averaged 2.08 candidates per seat, while even-numbered election years averaged 1.78 candidates per seat. The most recent May elections saw an average of 2.04 candidates per seat. The highest average number of candidates per seat in Texas school board elections occurred in 2021, when 2.20 candidates filed per seat. The lowest average number of candidates per seat was in 2020, with 1.68 candidates per seat.
- If the November elections mirror the May elections, 2023 will have the second-highest percentage of school board incumbents losing re-election between 2018 and 2023, breaking the trend of incumbents losing re-election at higher rates in even-numbered years.
- School board incumbents in Texas between 2018 and 2023 were likelier to lose re-election in even-numbered years than in odd-numbered years. During even-numbered years, 19.76% of incumbents who ran for re-election were defeated, compared to 14.44% of incumbents in odd-numbered years. During the May 2023 election, 22.02% of incumbents lost re-election. The highest average percentage of school board incumbents who lost re-election was in 2022, with 25.28%. The lowest average percentage of incumbents who lost re-election was in 2019, with 9.63%.
Ballotpedia’s school board coverage scope includes all school districts in the 100 largest cities by population, the 200 largest school districts by student enrollment, and, in 2023, all districts in Colorado, Kansas, Minnesota, Ohio, Oklahoma, Pennsylvania, South Dakota, Virginia, Washington, and Wisconsin.
Learn More