NVIDIA Corporation (NASDAQ:NVDA), Tesla, Inc (NASDAQ:TSLA) and Shake Shack, Inc (NYSE:SHAK) have all settled into bullish flag patterns on the daily chart. The bull flag pattern is created with a sharp rise higher forming the pole, which is then followed by a consolidation pattern that brings the stock lower between a channel with parallel lines.
- For bearish traders, the "trend is your friend" (until it's not) and the stock may continue downwards within the following channel for a short period of time. Aggressive traders may decide to short the stock at the upper trendline and exit the trade at the lower trendline.
- Bullish traders will want to watch for a break upward from the upper descending trendline of the flag formation, on high volume, for an entry. When a stock breaks up from a bull flag pattern, the measured move higher is equal to the length of the pole and should be added to the lowest price within the flag.
A bull flag is negated when a stock closes a trading day below the lower trendline of the flag pattern, or if the flag falls more than 50% down the length of the pole.
See Also: Elon Musk Takes A Dig At Lucid, Explains Why He Isn't Pushing For Longest Range EV
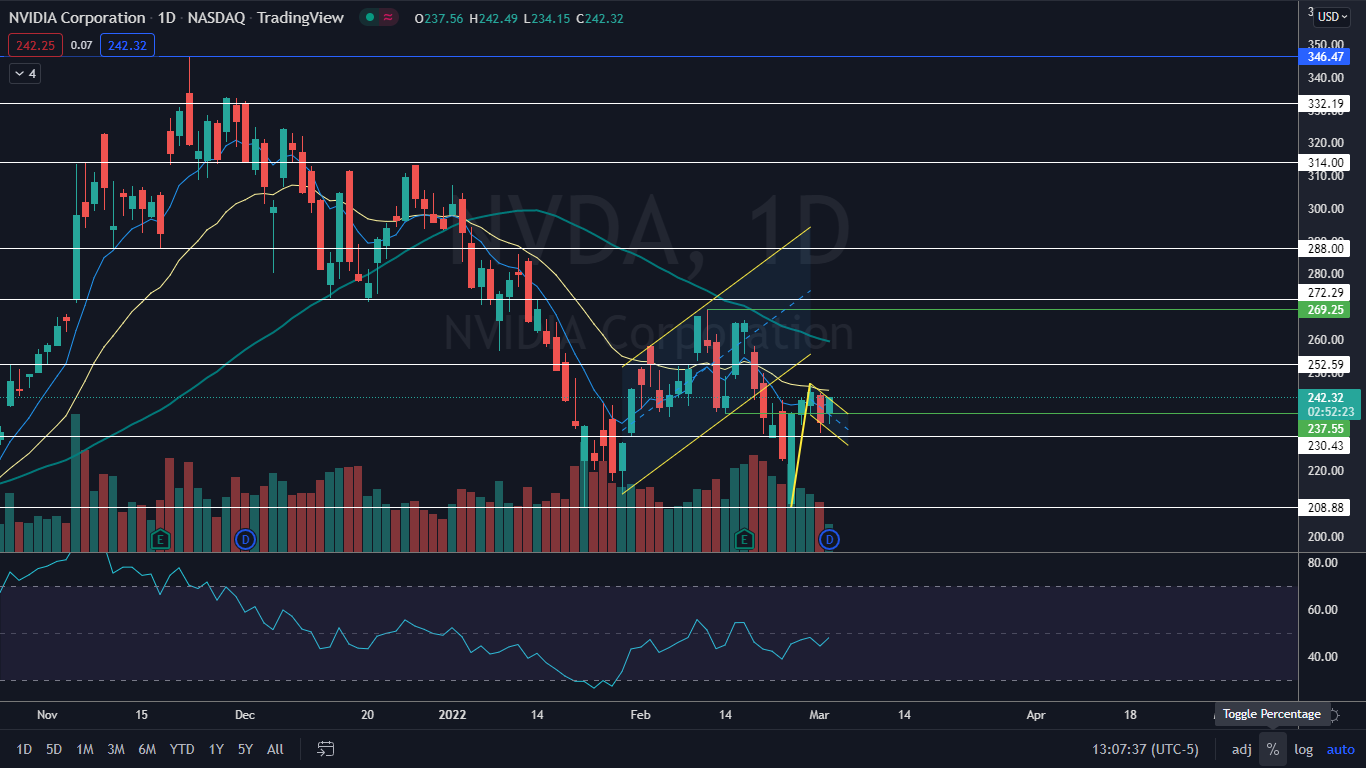
The Nvidia Chart: On Feb. 24, Nvidia gapped down to a support level near $209 where bulls came in heavily and bought the dip, causing the stock to soar up 16% between that date and Feb. 25 and Feb. 28.
- The steep reversal to the upside, paired with the consolidation that has taken place on Mar. 1 and Mar. 2 has settled the stock into a bull flag pattern, with a measured move that could take Nvidia up toward the $270 level if the formation is recognized.
- Traders can watch for an upward break from the parallel flag on higher-than-average volume to gauge that the pattern was recognized.
- Nvidia has resistance above at $252.59 and $272.29 and support below at $230.43 and $208.88.
Want direct analysis? Find me in the BZ Pro lounge! Click here for a free trial.
See Also: Nvidia Hackers Are Selling A Way Around Ethereum GPU Mining Limiter
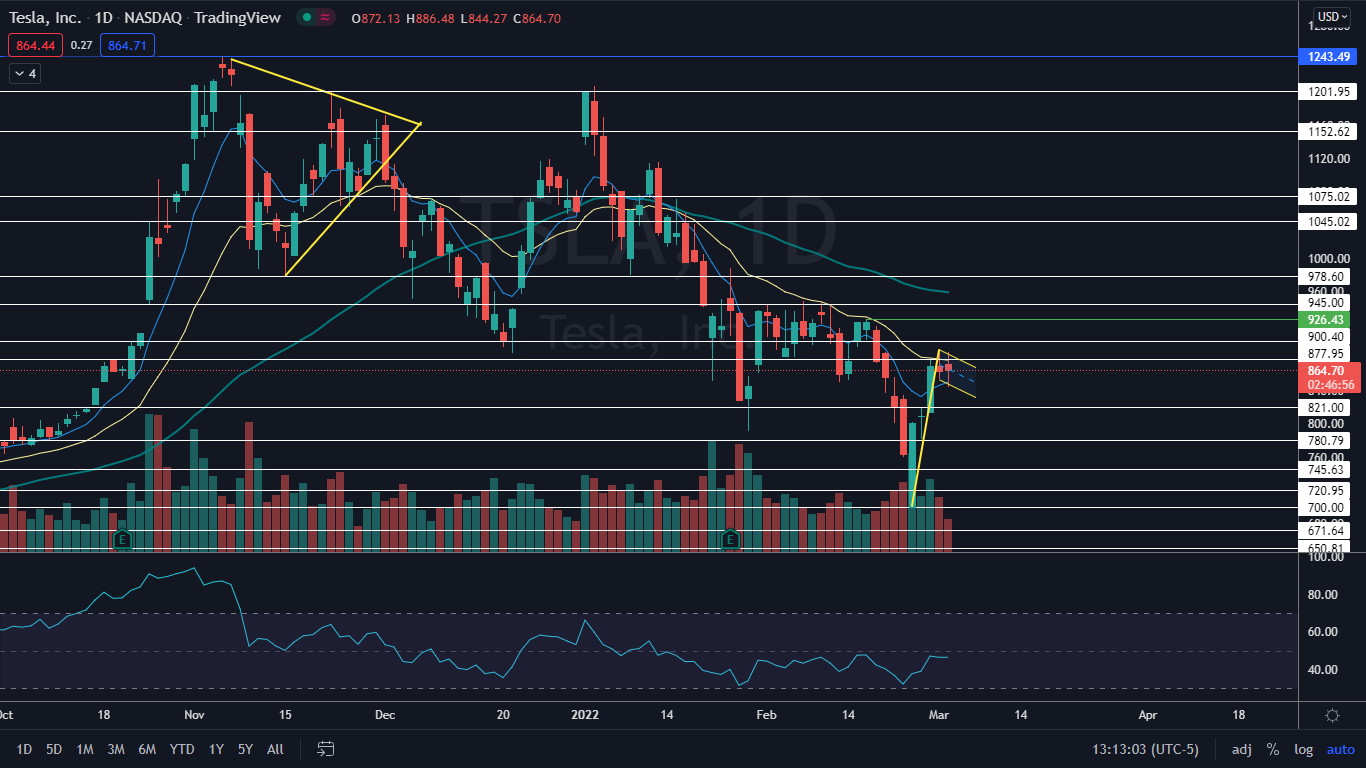
The Tesla Chart: Like Nvidia, Tesla gapped down to a heavy support area near the $700 mark on Feb. 24 and shot up 27% higher over the three trading days that followed.
- The push higher paired with Tuesday and Wednesday’s consolidation has settled the stock into a bull flag pattern, with a move up toward $1,072 if the formation is recognized.
- If Tesla closes the trading day near its opening price, it will print a doji candlestick, which could indicate a higher low is in, and the stock will now trade in an uptrend.
- Tesla has resistance above at $877.95 and $900.40 and support below at $821 and $780.79.
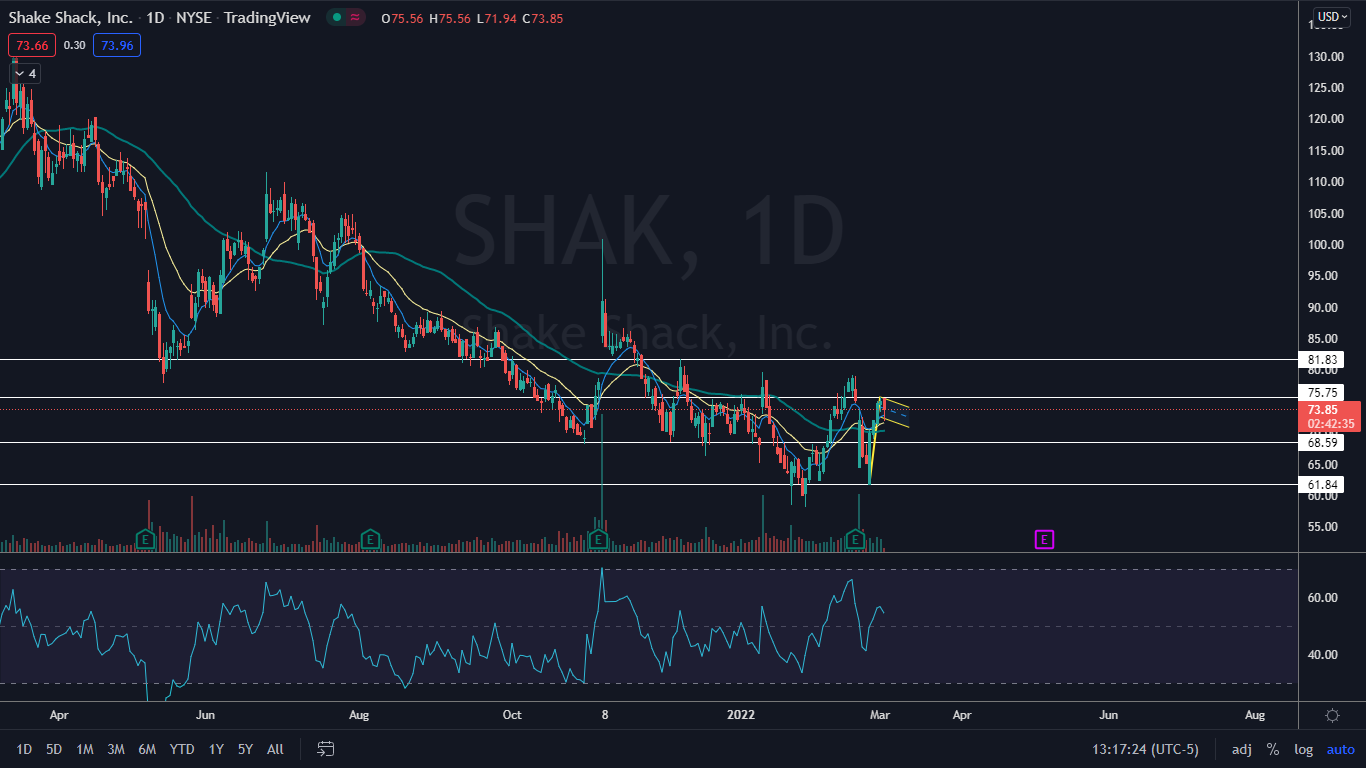
The Shake Shack Chart: Shake Shack also gapped down on Feb. 24, before shooting up 23% over the course of four trading days to reach the $75.75 level.
- The climb higher may be the pole of a possible bull flag pattern and the stock may have begun to form the flag formation on Wednesday, but at least one more candle still likely needs to print for confirmation.
- Shake Shack had lower-than-average volume on its 1.7% decline on Wednesday, which indicates consolidation and should not be a red flag for bullish traders.
- Shake Shack has resistance above at $75.75 and $81.83 and support below at $68.59 and $61.84.