Saleforce.com Inc. (NASDAQ:MRNA) shares are trading higher Wednesday after the company reported better-than-expected fourth-quarter financial results and issued guidance above estimates.
Salesforce said quarterly revenue increased 26% year-over-year to $7.33 billion, beating the $7.24 billion estimate. The company reported quarterly earnings of 84 cents per share, beating the estimate of 75 cents per share.
Saleforce was up 0.9% at $210.78 Wednesday afternoon.
See Also: Why Salesforce Shares Are Rising Today
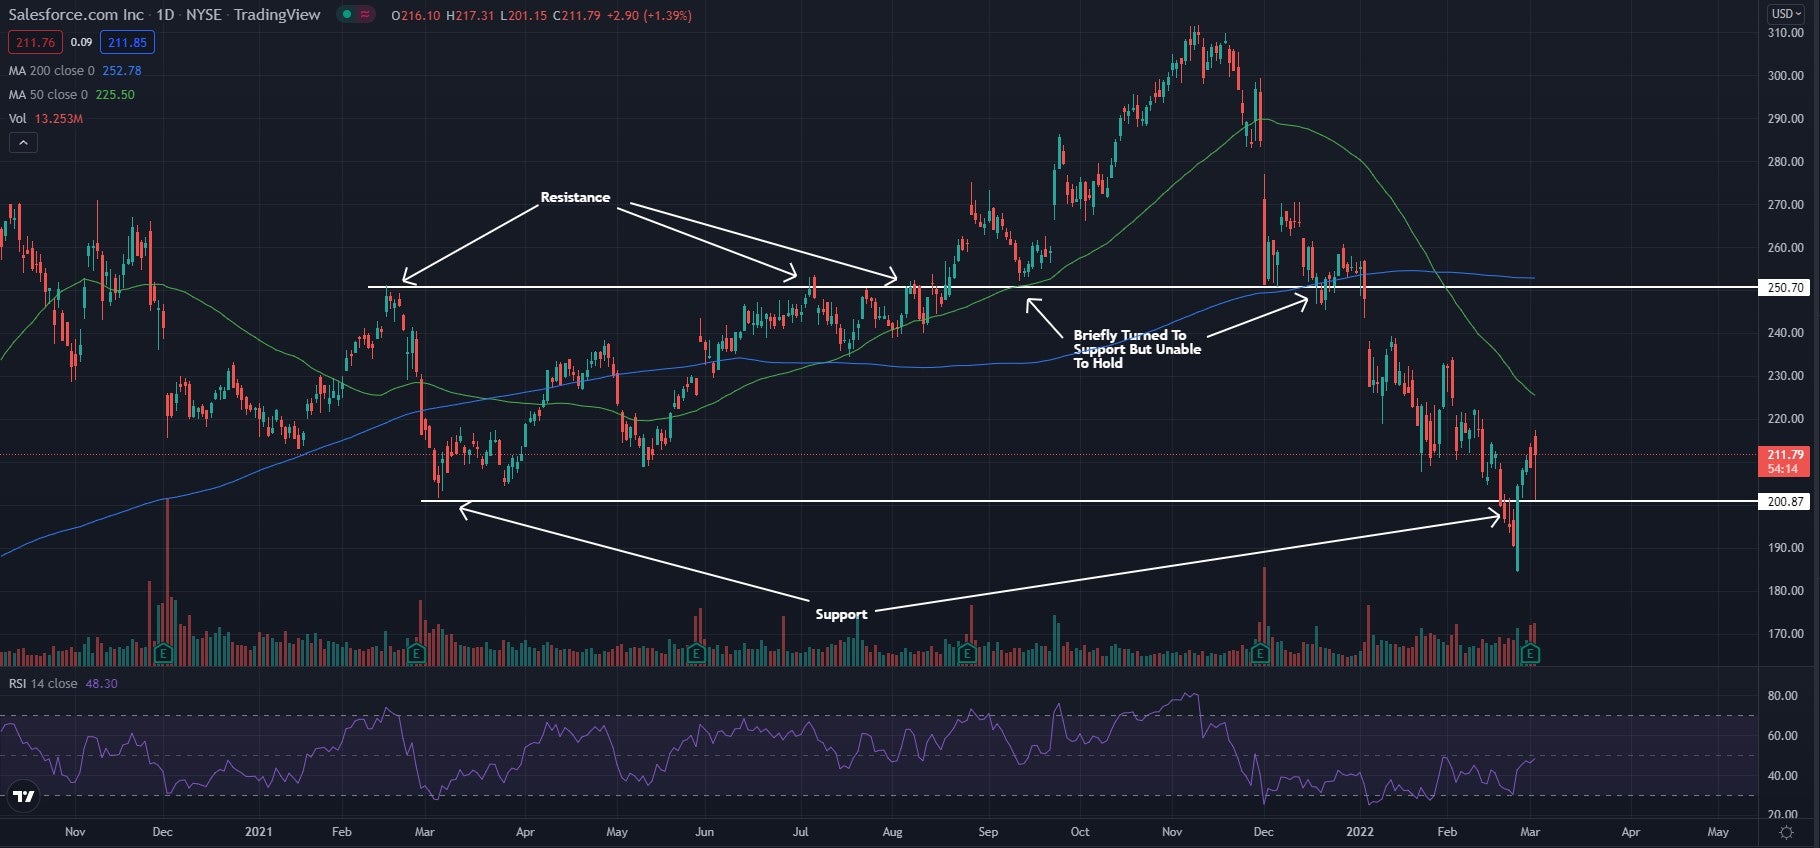
Saleforce Daily Chart Analysis
- The stock has been on a strong downward trend, but within the last few days it looks to be seeing a bounce back. The stock trades in a sideways channel with support near the $200 level and resistance near the $250 level. Each of these levels are areas where the stock has bounced or been rejected before.
- The stock trades below both the 50-day moving average (green) and the 200-day moving average (blue). This indicates bearish sentiment, and each of these moving averages may hold as an area of resistance in the future.
- The Relative Strength Index (RSI) has been jumping higher in recent days and now sits at 48. This shows that more buyers have been entering the market and there is now almost equivalent buying and selling pressure. If the RSI continues to increase, the stock may keep pushing higher toward resistance.
What’s Next For Salesforce?
Salesforce is in a period where it may be bouncing off a key level and could see a reversal if this upward movement continues. If the price falls back below the $200 level, the stock may continue the downward trend it has been on for the last few months.
Bullish traders want to see the stock form higher lows and continue to head higher. Bulls also want the RSI to stay above the middle line to keep buying pressure greater than selling pressure.
Bearish traders want to see the RSI get rejected at the middle line and for the stock to start to dip lower, eventually crossing back below the $200 level. If the stock can hold the $200 level as an area of resistance, the price may see a further strong bearish push.